

Question: I need help solving 12, 13, 14 and 15. attached balance sheet and income. EYK14-5. Accounting Research Problem: General Mills, Inc. The fiscal year 2017
I need help solving 12, 13, 14 and 15. attached balance sheet and income.
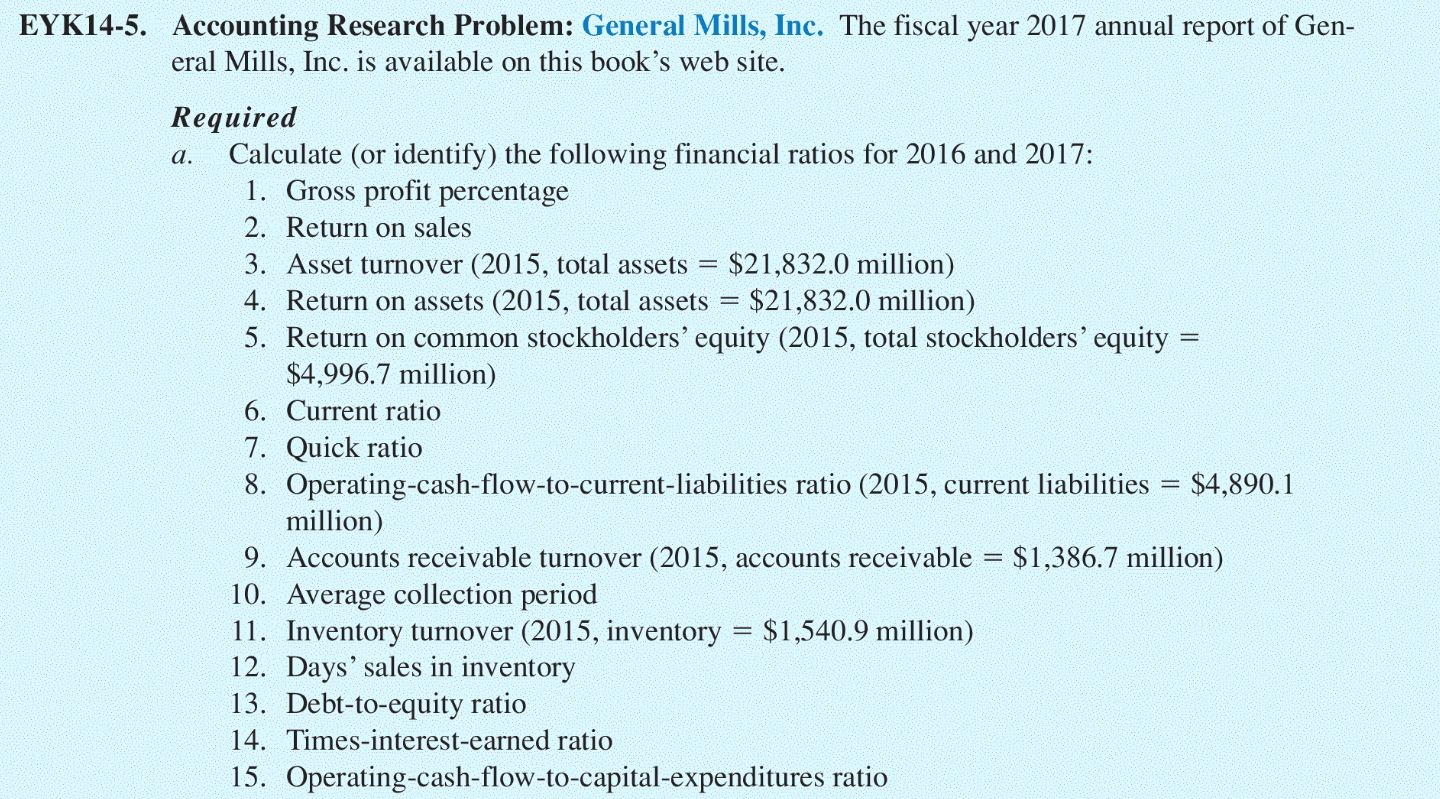
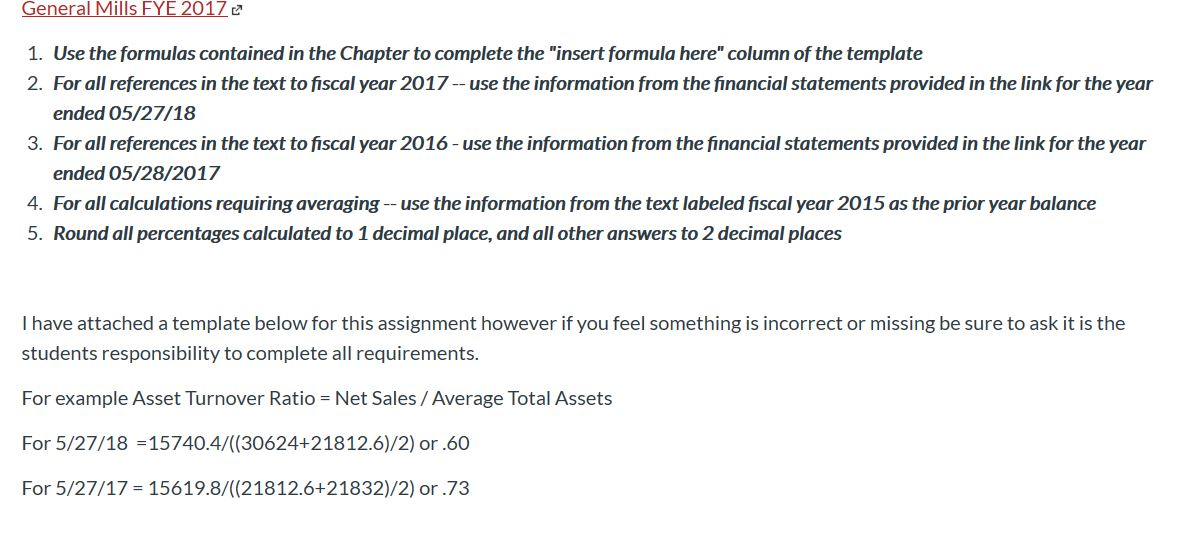
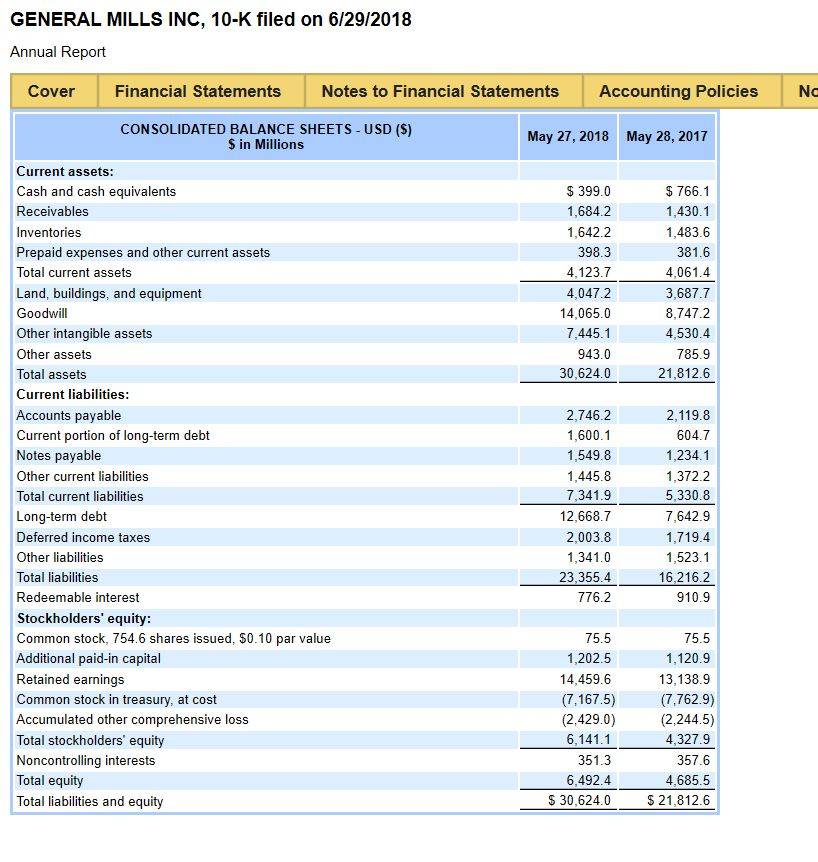
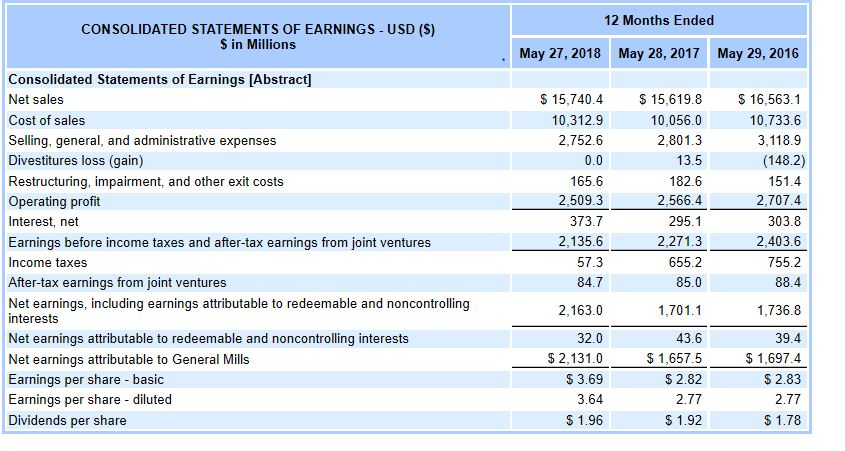
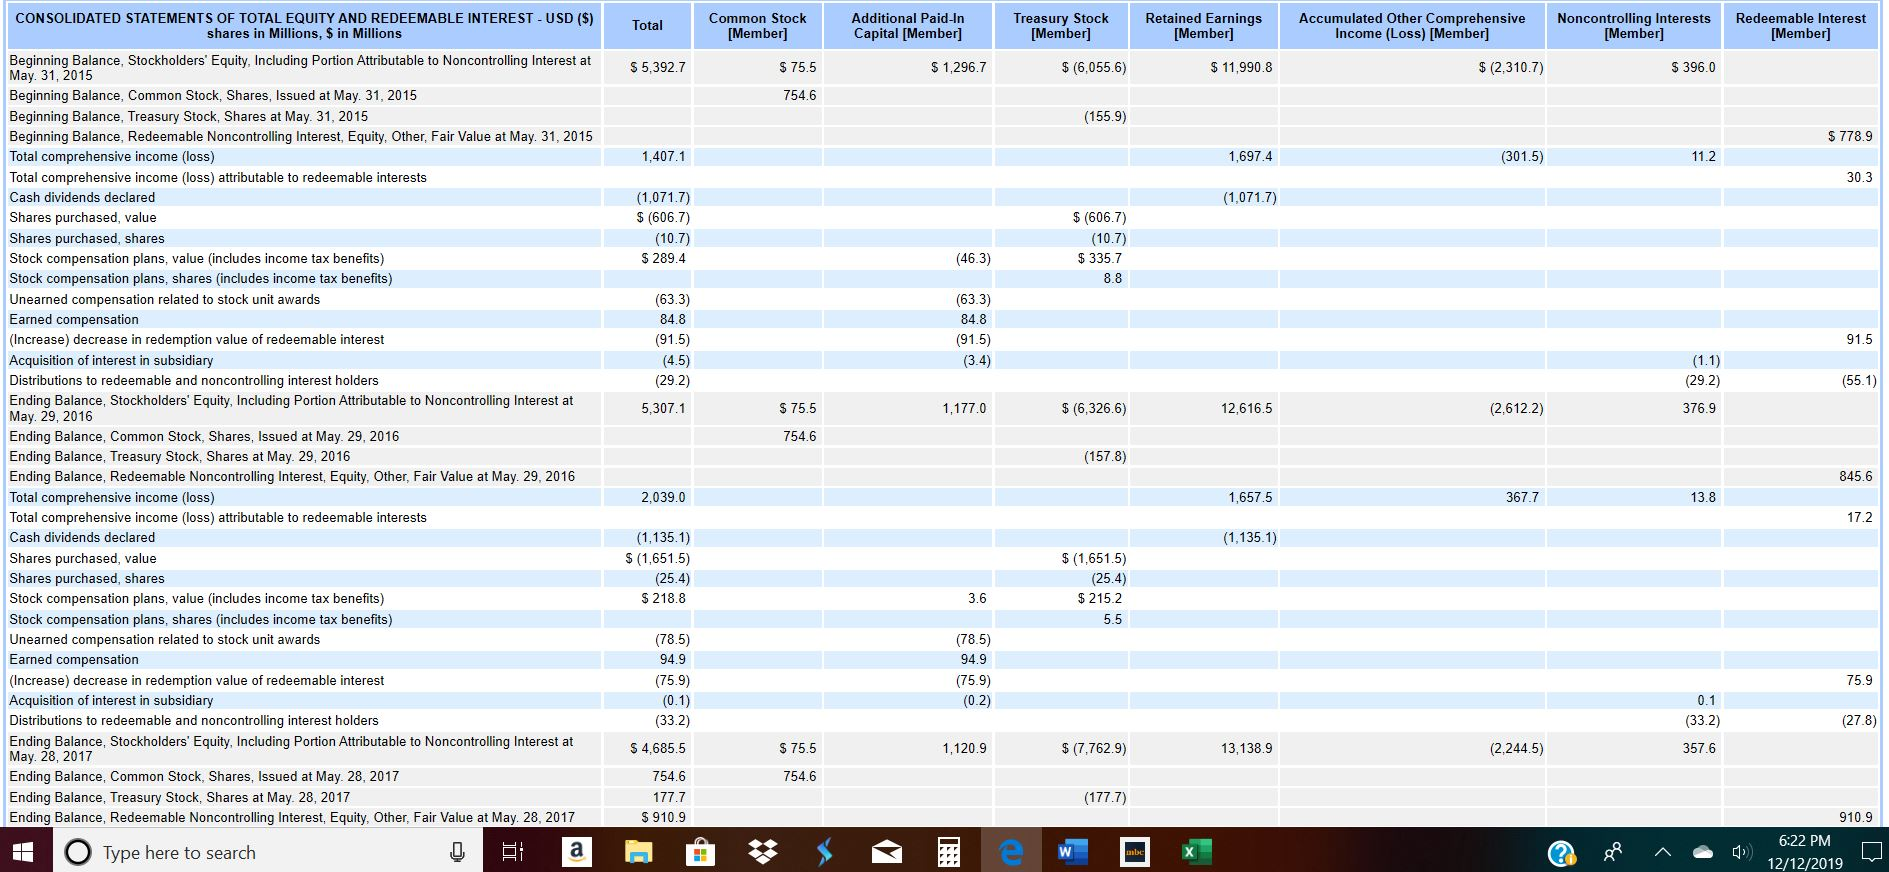
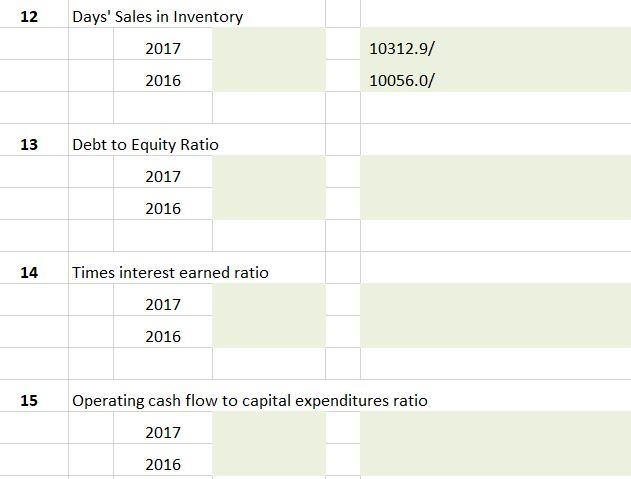
EYK14-5. Accounting Research Problem: General Mills, Inc. The fiscal year 2017 annual report of Gen- eral Mills, Inc. is available on this book's web site. Required a. Calculate (or identify) the following financial ratios for 2016 and 2017: 1. Gross profit percentage 2. Return on sales 3. Asset turnover (2015, total assets = $21,832.0 million) 4. Return on assets (2015, total assets = $21,832.0 million) 5. Return on common stockholders' equity (2015, total stockholders' equity = $4,996.7 million) 6. Current ratio 7. Quick ratio 8. Operating-cash-flow-to-current-liabilities ratio (2015, current liabilities = $4,890.1 million) 9. Accounts receivable turnover (2015, accounts receivable = $1,386.7 million) 10. Average collection period 11. Inventory turnover (2015, inventory = $1,540.9 million) 12. Days' sales in inventory 13. Debt-to-equity ratio 14. Times-interest-earned ratio 15. Operating-cash-flow-to-capital-expenditures ratio General Mills FYE 2017 1. Use the formulas contained in the Chapter to complete the "insert formula here" column of the template 2. For all references in the text to fiscal year 2017 -- use the information from the financial statements provided in the link for the year ended 05/27/18 3. For all references in the text to fiscal year 2016 - use the information from the financial statements provided in the link for the year ended 05/28/2017 4. For all calculations requiring averaging -- use the information from the text labeled fiscal year 2015 as the prior year balance 5. Round all percentages calculated to 1 decimal place, and all other answers to 2 decimal places I have attached a template below for this assignment however if you feel something is incorrect or missing be sure to ask it is the students responsibility to complete all requirements. For example Asset Turnover Ratio = Net Sales / Average Total Assets For 5/27/18 =15740.4/((30624+21812.6)/2) or .60 For 5/27/17 = 15619.8/((21812.6+21832)/2) or .73 GENERAL MILLS INC, 10-K filed on 6/29/2018 Annual Report Cover Financial Statements Notes to Financial Statements Accounting Policies No CONSOLIDATED BALANCE SHEETS - USD ($) Sin Millions May 27, 2018 May 28, 2017 $ 399.0 1,684.2 1,642.2 398.3 4,123.7 4,047.2 14,065.0 7,445.1 943.0 30,624.0 $ 766.1 1,430.1 1,483.6 381.6 4,061.4 3,687.7 8,747.2 4,530.4 785.9 21,812.6 Current assets: Cash and cash equivalents Receivables Inventories Prepaid expenses and other current assets Total current assets Land, buildings, and equipment Goodwill Other intangible assets Other assets Total assets Current liabilities: Accounts payable Current portion of long-term debt Notes payable Other current liabilities Total current liabilities Long-term debt Deferred income taxes Other liabilities Total liabilities Redeemable interest Stockholders' equity: Common stock, 754.6 shares issued, $0.10 par value Additional paid-in capital Retained earnings Common stock in treasury, at cost Accumulated other comprehensive loss Total stockholders' equity Noncontrolling interests Total equity Total liabilities and equity 2,746.2 1,600.1 1,549.8 1,445.8 7,341.9 12,668.7 2,003.8 1,341.0 23,355.4 776.2 2,119.8 604.7 1,234.1 1,372.2 5,330.8 7,642.9 1,719.4 1,523.1 16,216.2 910.9 75.5 1,202.5 14,459.6 (7,167.5) (2.429.0) 6,141.1 351.3 6,492.4 $ 30,624.0 75.5 1,120.9 13,138.9 (7,762.9) (2,244.5) 4.327.9 357.6 4.685.5 $21,812.6 12 Months Ended CONSOLIDATED STATEMENTS OF EARNINGS- USD ($) S in Millions May 27, 2018 May 28, 2017 May 29, 2016 Consolidated Statements of Earnings [Abstract] Net sales Cost of sales Selling, general, and administrative expenses Divestitures loss (gain) Restructuring, impairment, and other exit costs Operating profit Interest, net Earnings before income taxes and after-tax earnings from joint ventures Income taxes After-tax earnings from joint ventures Net earnings, including earnings attributable to redeemable and noncontrolling interests Net earnings attributable to redeemable and noncontrolling interests Net earnings attributable to General Mills Earnings per share - basic Earnings per share - diluted Dividends per share $ 15,740.4 10,312.9 2,752.6 0.0 165.6 2,509.3 373.7 2,135.6 57.3 84.7 2,163.0 $ 15,619.8 10,056.0 2,801.3 13.5 182.6 2,566.4 295.1 2,271.3 655.2 85.0 $ 16,563.1 10,733.6 3,118.9 (148.2) 151.4 2,707.4 303.8 2,403.6 755.2 88.4 1,701.1 1,736.8 43.6 32.0 $ 2,131.0 $ 3.69 3.64 $ 1.96 $ 1,657.5 $ 2.82 2.77 $ 1.92 39.4 $ 1,697.4 $ 2.83 2.77 $ 1.78 Total Common Stock [Member] Additional Paid-In Capital (Member) Treasury Stock [Member] Retained Earnings [Member] Accumulated Other Comprehensive Income (Loss) [Member] Noncontrolling Interests [Member] Redeemable Interest [Member] $ 5,392.7 $ 1,296.7 $ (6,055.6) $ 11,990.8 $ (2,310.7) $ 396.0 $ 75.5 754.6 (155.9) $778.9 1,407.1 1,697.4 (301.5) 11.2 30.3 (1.071.7) (1,071.7) $ (606.7) (10.7) $ 289.4 $ (606.7) (10.7) $ 335.7 8.8 (46.3) (63.3) 84.8 (91.5) (4.5) (29.2) 5,307.1 (63.3) 84.8 (91.5) (3.4) 91.5 (1.1) (29.2) (55.1) $ 75.5 1.177.0 $ (6,326.6) 12,616.5 (2.612.2) 376.9 CONSOLIDATED STATEMENTS OF TOTAL EQUITY AND REDEEMABLE INTEREST - USD ($) shares in Millions, $ in Millions Beginning Balance, Stockholders' Equity, Including Portion Attributable to Noncontrolling Interest at May 31, 2015 Beginning Balance, Common Stock, Shares, Issued at May 31, 2015 Beginning Balance, Treasury Stock, Shares at May 31, 2015 Beginning Balance, Redeemable Noncontrolling Interest, Equity, Other, Fair Value at May 31, 2015 Total comprehensive income (loss) Total comprehensive income (loss) attributable to redeemable interests Cash dividends declared Shares purchased, value Shares purchased, shares Stock compensation plans, value (includes income tax benefits) Stock compensation plans, shares (includes income tax benefits) Unearned compensation related to stock unit awards Earned compensation (Increase) decrease in redemption value of redeemable interest Acquisition of interest in subsidiary Distributions to redeemable and noncontrolling interest holders Ending Balance, Stockholders' Equity, Including Portion Attributable to Noncontrolling Interest at May 29, 2016 Ending Balance, Common Stock, Shares, Issued at May 29, 2016 Ending Balance, Treasury Stock, Shares at May 29, 2016 Ending Balance, Redeemable Noncontrolling Interest, Equity, Other, Fair Value at May 29, 2016 Total comprehensive income (loss) Total comprehensive income (loss) attributable to redeemable interests Cash dividends declared Shares purchased, value Shares purchased, shares Stock compensation plans, value (includes income tax benefits) Stock compensation plans, shares (includes income tax benefits) Unearned compensation related to stock unit awards Earned compensation (Increase) decrease in redemption value of redeemable interest Acquisition of interest in subsidiary Distributions to redeemable and noncontrolling interest holders Ending Balance, Stockholders' Equity, Including Portion Attributable to Noncontrolling Interest at May 28, 2017 Ending Balance, Common Stock, Shares, Issued at May 28, 2017 Ending Balance, Treasury Stock, Shares at May 28, 2017 Ending Balance, Redeemable Noncontrolling Interest, Equity, Other, Fair Value at May 28, 2017 754.6 (1578) 845.6 2,039.0 1,657.5 367.7 13.8 17.2 (1.135.1) (1,135.1) $(1,651.5) (25.4) $ 218.8 $(1,651.5) (25.4) $ 215.2 5.5 3.6 (78.5) 94.9 (75.9) (0.2) 75.9 (78.5) 94.9 (75.9) (0.1) (33.2) $ 4,685.5 754.6 177.7 $910.9 0.1 (33.2) (278) $ 75.5 1,120.9 $ (7,762.9) 13,138.9 (2,244.5) 357.6 754.6 (177.7) 910.9 O Type here to search gl . ) 6:22 PM 12/12/2019 12 Days' Sales in Inventory 2017 10312.9/ 2016 10056.0/ 13 Debt to Equity Ratio 2017 2016 14 Times interest earned ratio 2017 2016 15 Operating cash flow to capital expenditures ratio 2017 2016
Step by Step Solution
There are 3 Steps involved in it

Get step-by-step solutions from verified subject matter experts