

Question: I need help solving.. I will be looking at personal income taxes.In 2017 it was normal to be able to have deductions and a personal
I need help solving..
I will be looking at personal income taxes.In 2017 it was normal to be able to have "deductions" and a "personal exemption" deducted from one's total income before determining theirtaxableincome.We will consider only a "single" filing status.
In 2017, the standard deduction was $6,350 and the personal exemption was $4,050.So, an individual who brought in atotal incomeof $30,000 would have to pay taxes on $19,600 ($30,000-$6,350-$4050).The $19,600 represents theirtaxable income.
-Taxable Incomerefers to income after accounting for the standard deduction and personal exemption.
-Total Incomerefers to income prior to the standard deduction and personal exemption.
Consider a simplified version of the real tax code.Assume that the tax rate on all taxable income is 15% and the standard deduction ($6,350) and personal exemption ($4,050) still apply.
- If yourtotal incomebefore exemptions was $35,000, what is yourtaxable income?
- How much would you have to pay in taxes on this income?
- What percentage of yourtotal incomewould you pay in taxes?
- What is the function to model the total tax paid, T(x), with atotal incomeof x dollars.
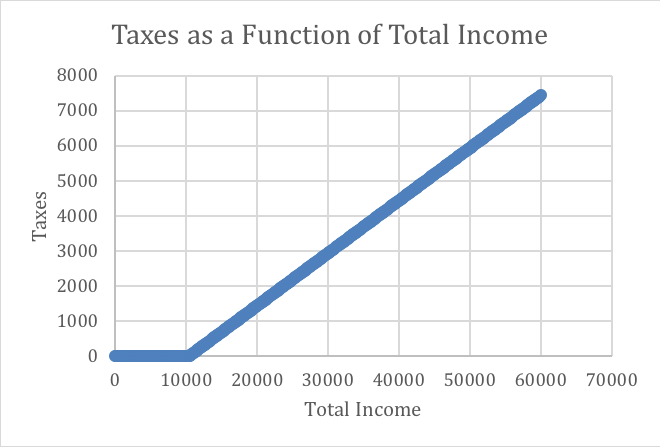
- How many different slopes are on this graph (below)? What do they represent?
Below a graph that shows taxes paid as a function oftotal incomefor the total income between $0 and $60,000:
\f
Step by Step Solution
There are 3 Steps involved in it

Get step-by-step solutions from verified subject matter experts