Question: I need help solving questions 1 - 4. Please and Thank you. In this question, we examine the Mincer regression in detail. Recall that in

I need help solving questions 1 - 4. Please and Thank you. I need help solving questions 1 - 4. Please and

In this question, we examine the Mincer regression in detail. Recall that in the lab section, the Mincer regression is defined as following: In(wage;) = 30 + Bjeduc; +Baexperience; +33(experience;)2 + Ui In the table below, we show the regression results of 4 different models. To understand the table, for example, the column (1) shows the regression result of regressing the In(wage) on years of education, for another example, the Mincer regression results are shown in column (3). 1. Write down the model for each of the columns shown in the table. Hint: the column (3) is already given in the question. 2. Now focus on the models in columns (1) and (2). Suppose it is known that the education and experience are negatively correlated. Write down the formula for omitted variable bias (OVB) on the coefficient on education. Based on the formula, what do you expect the sign of the OVB? Is this consistent with the results shown in columns (1) and (2)? 3. Now focus on the models in columns (1) and (3). We assume homoskedasticity. Formulate and test the joint hypotheses that the experience and the square of experience are not associated with In(wage) at 5% level. 4. Now focus on the model in column (3). How would you interpret the coefficient on education? 2 Table 1: y= ln (wage) Intercept (1) 0.7705*** (0.042) 0.1049*** (0.003) education (2) 0.4261*** (0.042) 0.1136*** (0.003) 0.0121*** (0.001) experience (3) (4) 0.3173*** 0.3076*** (0.042) (0.041) 0.1076*** 0.1168*** (0.003) (0.003) 0.0390*** 0.0391*** (0.002) (0.002) -0.0007*** -0.0007*** (0.0000) (0.0000) -0.0175*** (0.001) 1733 1733 0.292 0.338 experience femalex educ N R2 1733 0.202 4733 0.263 (1) Standard errors in parentheses. (2) * if p<.1 if p .05 .01 in this question we examine the mincer regression detail. recall that lab section is defined as following: bjeduc ui table below show results of different models. to understand for example column shows result regressing on years education another are shown write down model each columns table. hint: already given question. now focus models and suppose it known experience negatively correlated. formula omitted variable bias coefficient education. based what do you expect sign ovb consistent with assume homoskedasticity. formulate test joint hypotheses square not associated at level. how would interpret y="ln" intercept femalex educ n r2 standard errors parentheses.>

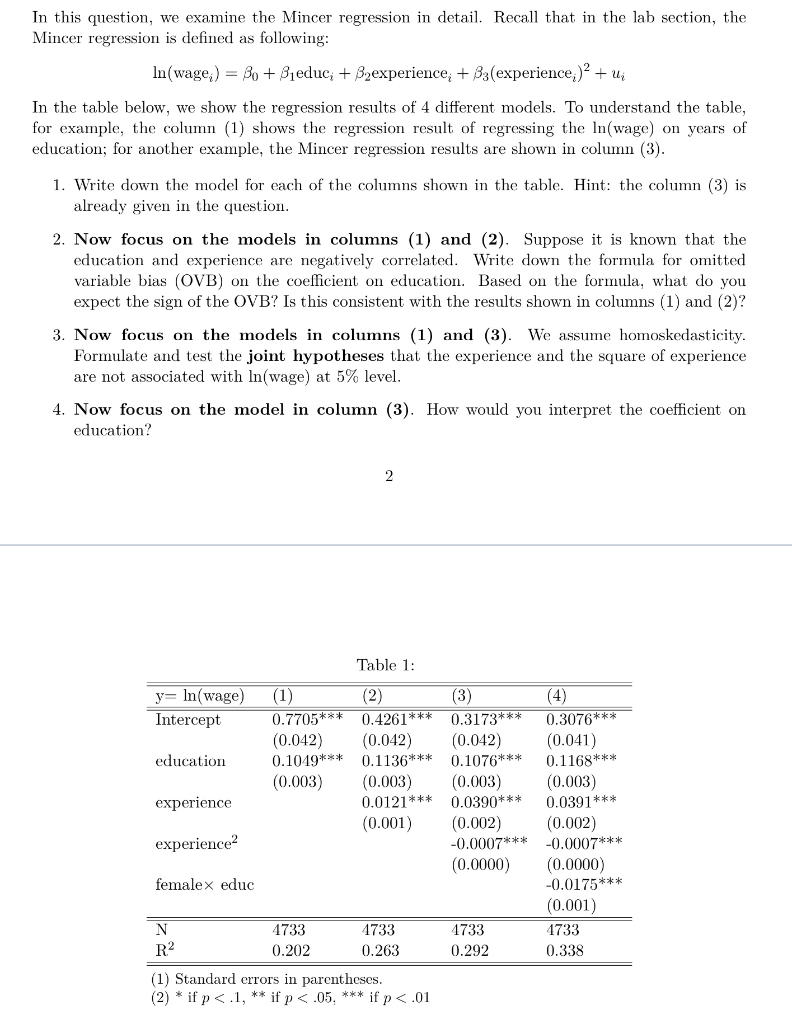
Step by Step Solution

There are 3 Steps involved in it

1 Expert Approved Answer
Step: 1 Unlock blur-text-image
Question Has Been Solved by an Expert!

Get step-by-step solutions from verified subject matter experts

Step: 2 Unlock
Step: 3 Unlock

Students Have Also Explored These Related General Management Questions!