

Question: I need help solving some statistic problem. The problems are based on the Wilcoxon?signed-ranks test. The questions i need help on are 1-4 Section 17.1
I need help solving some statistic problem. The problems are based on the Wilcoxon?signed-ranks test. The questions i need help on are 1-4
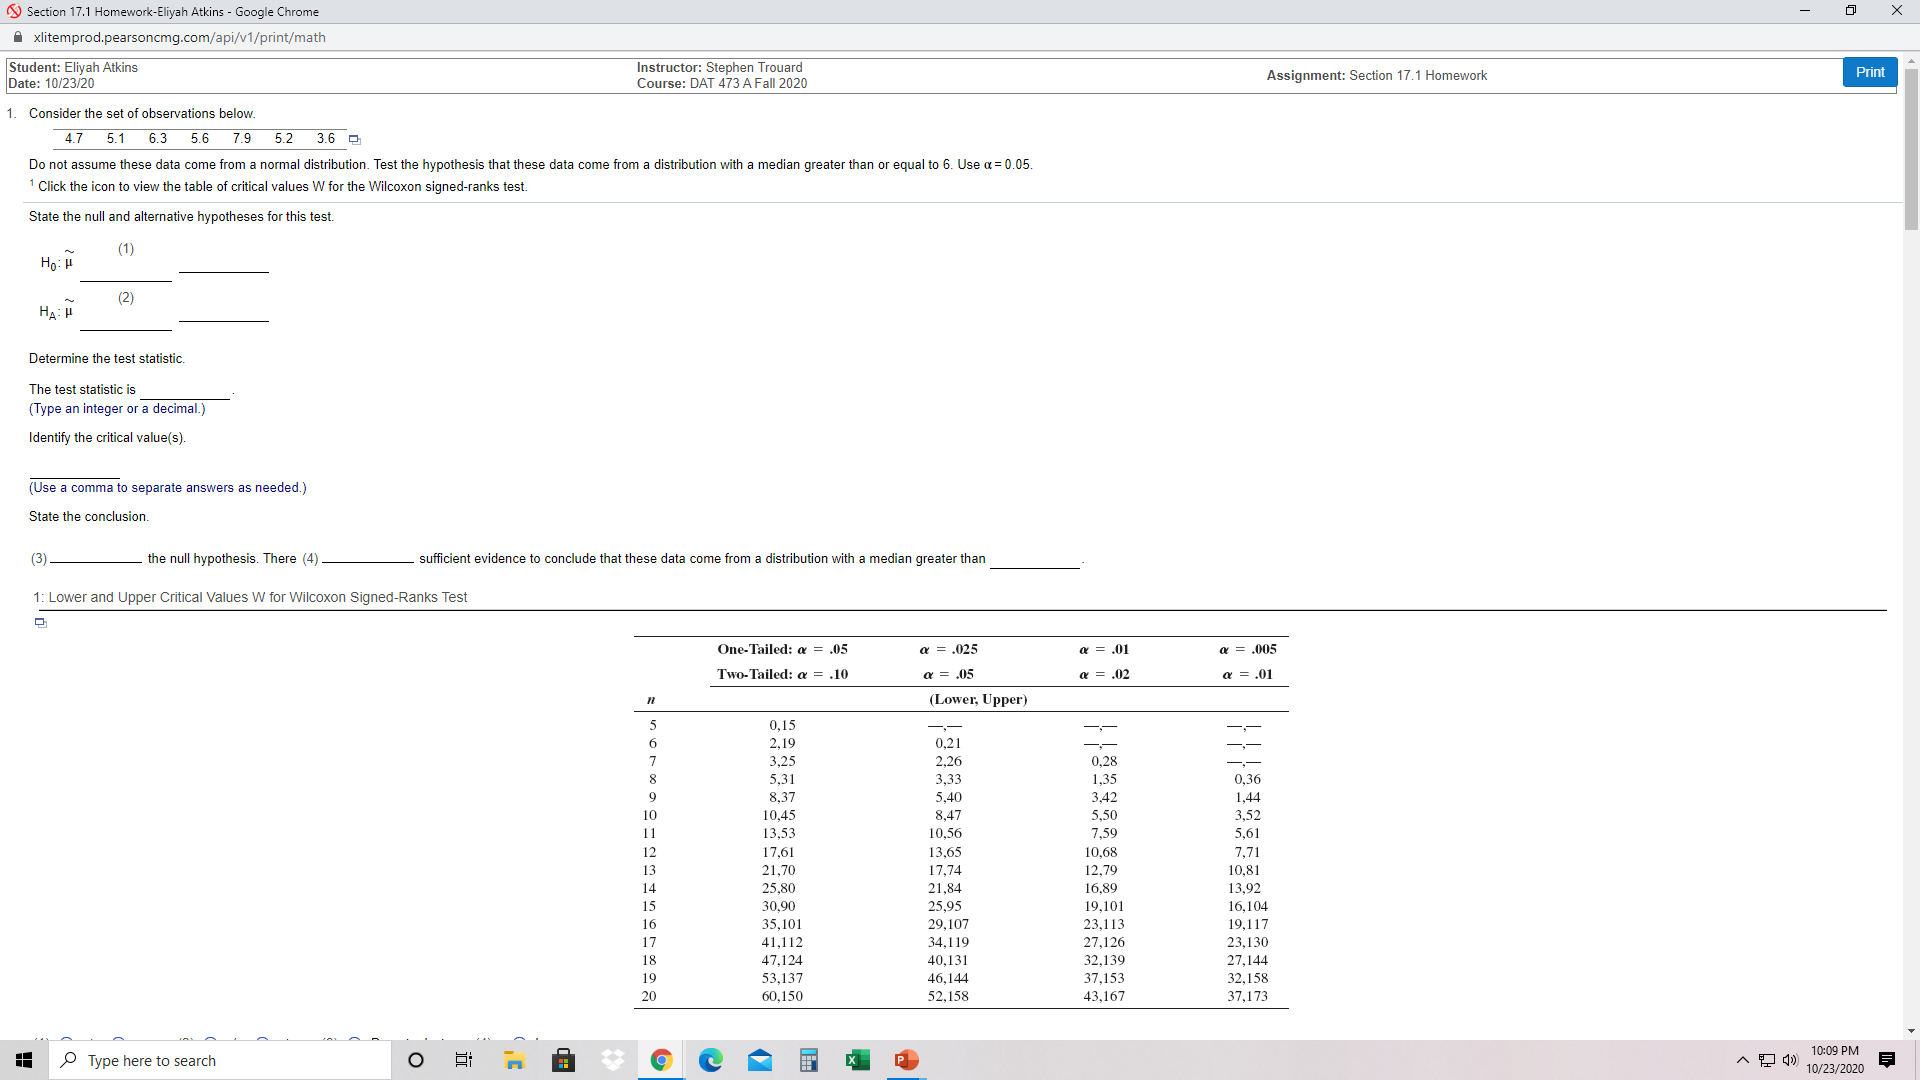
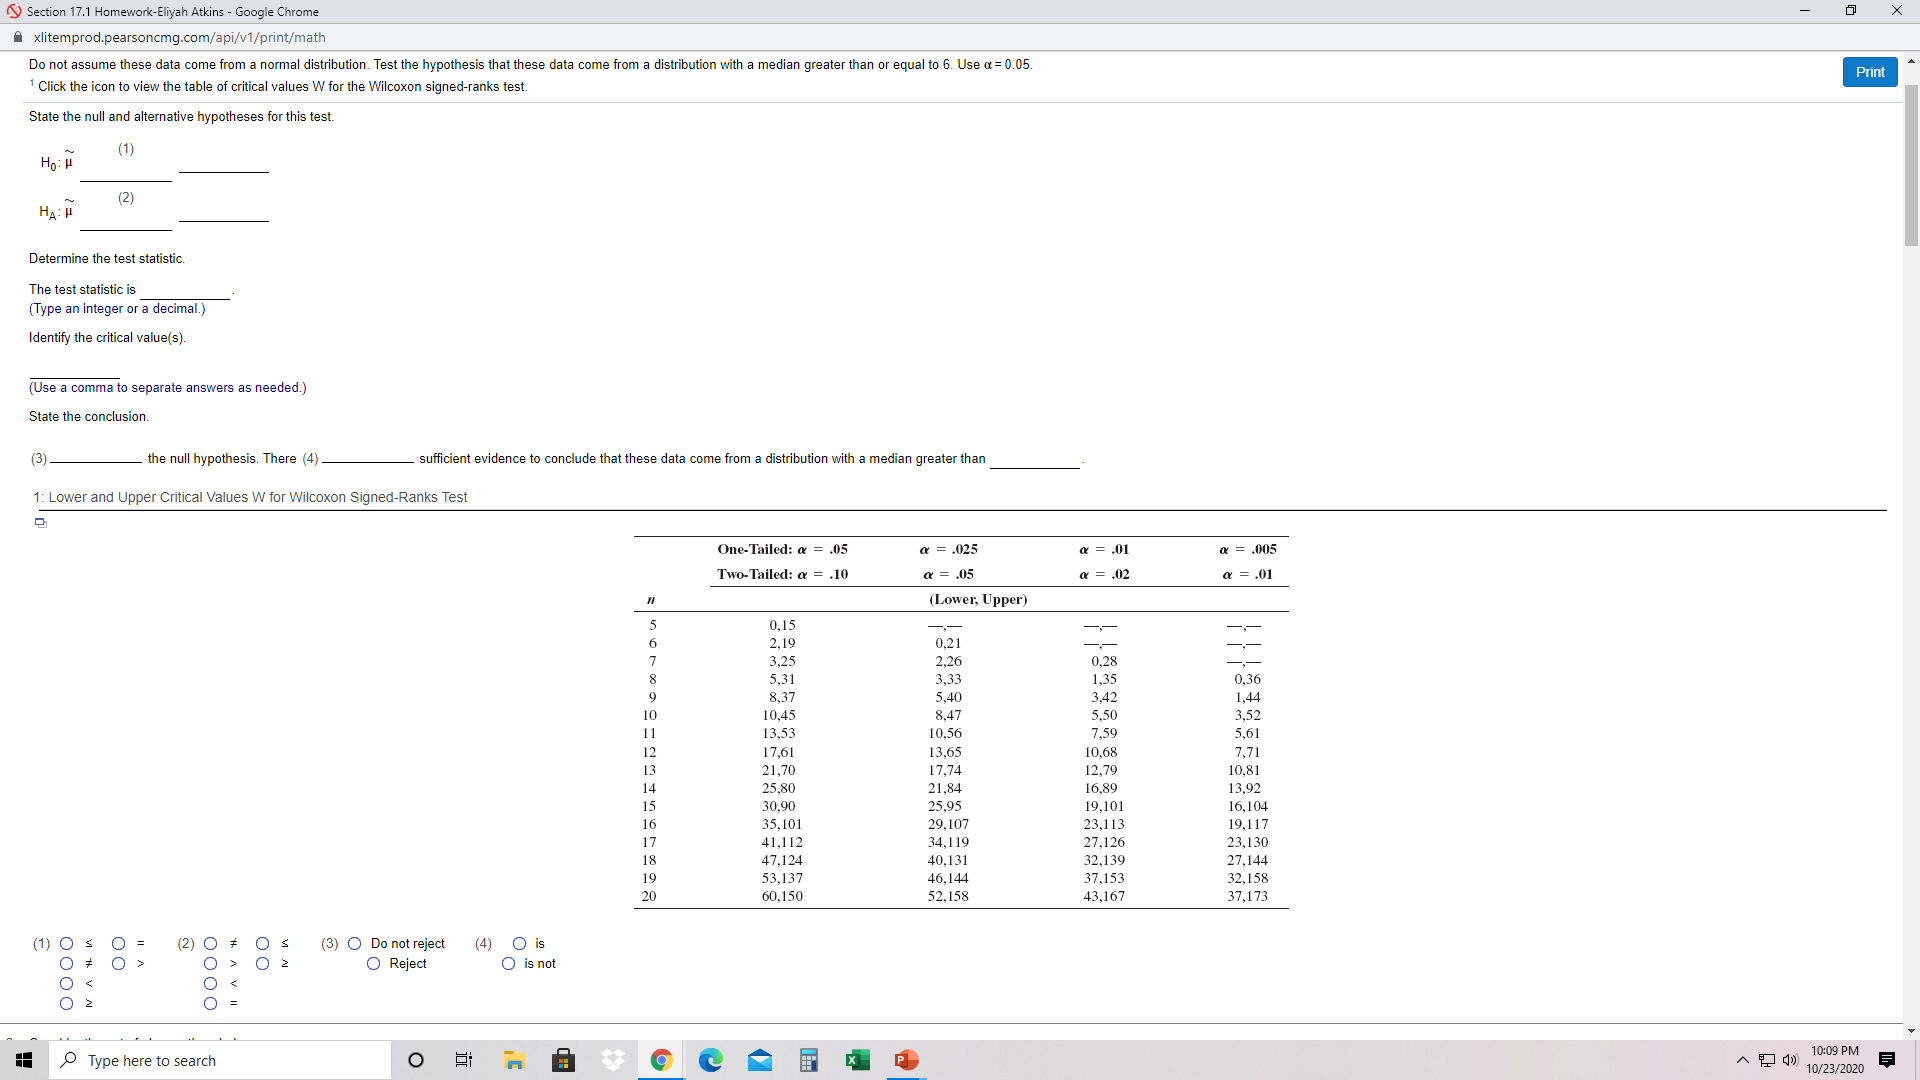
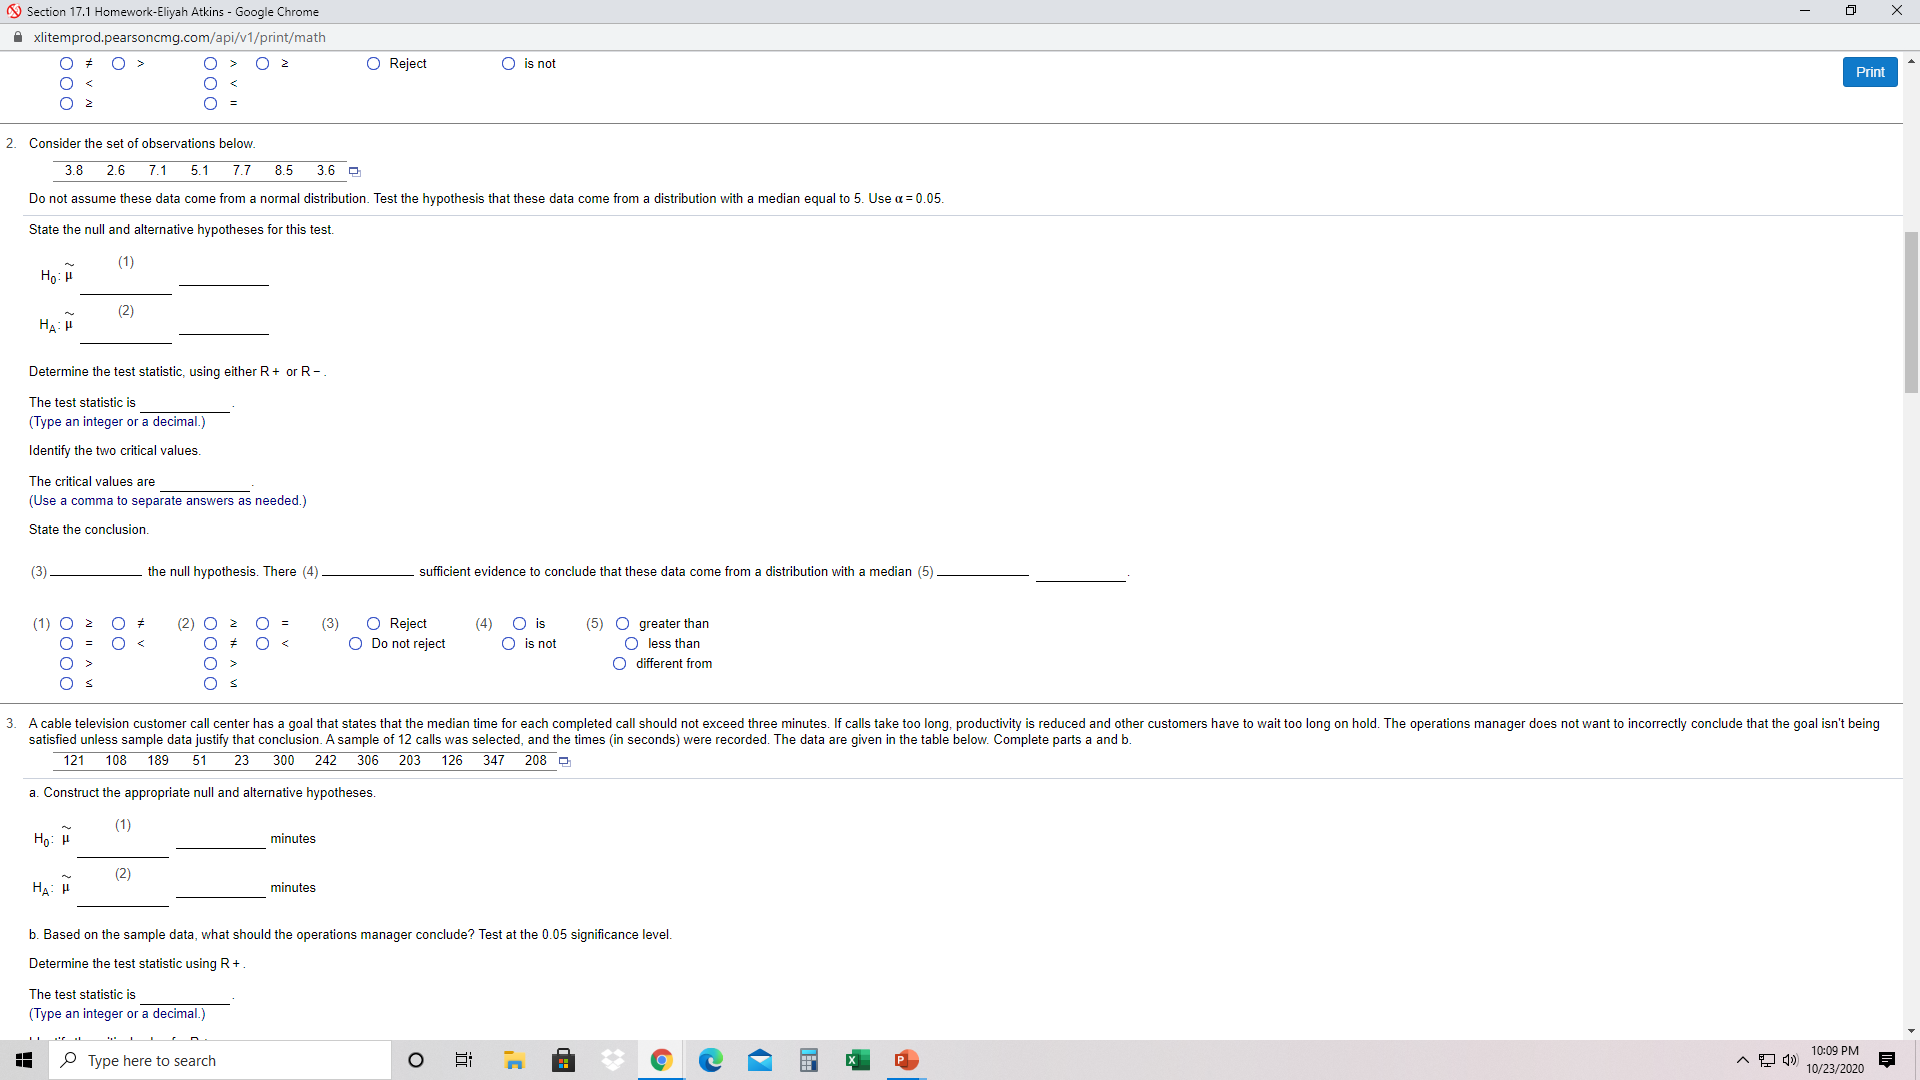
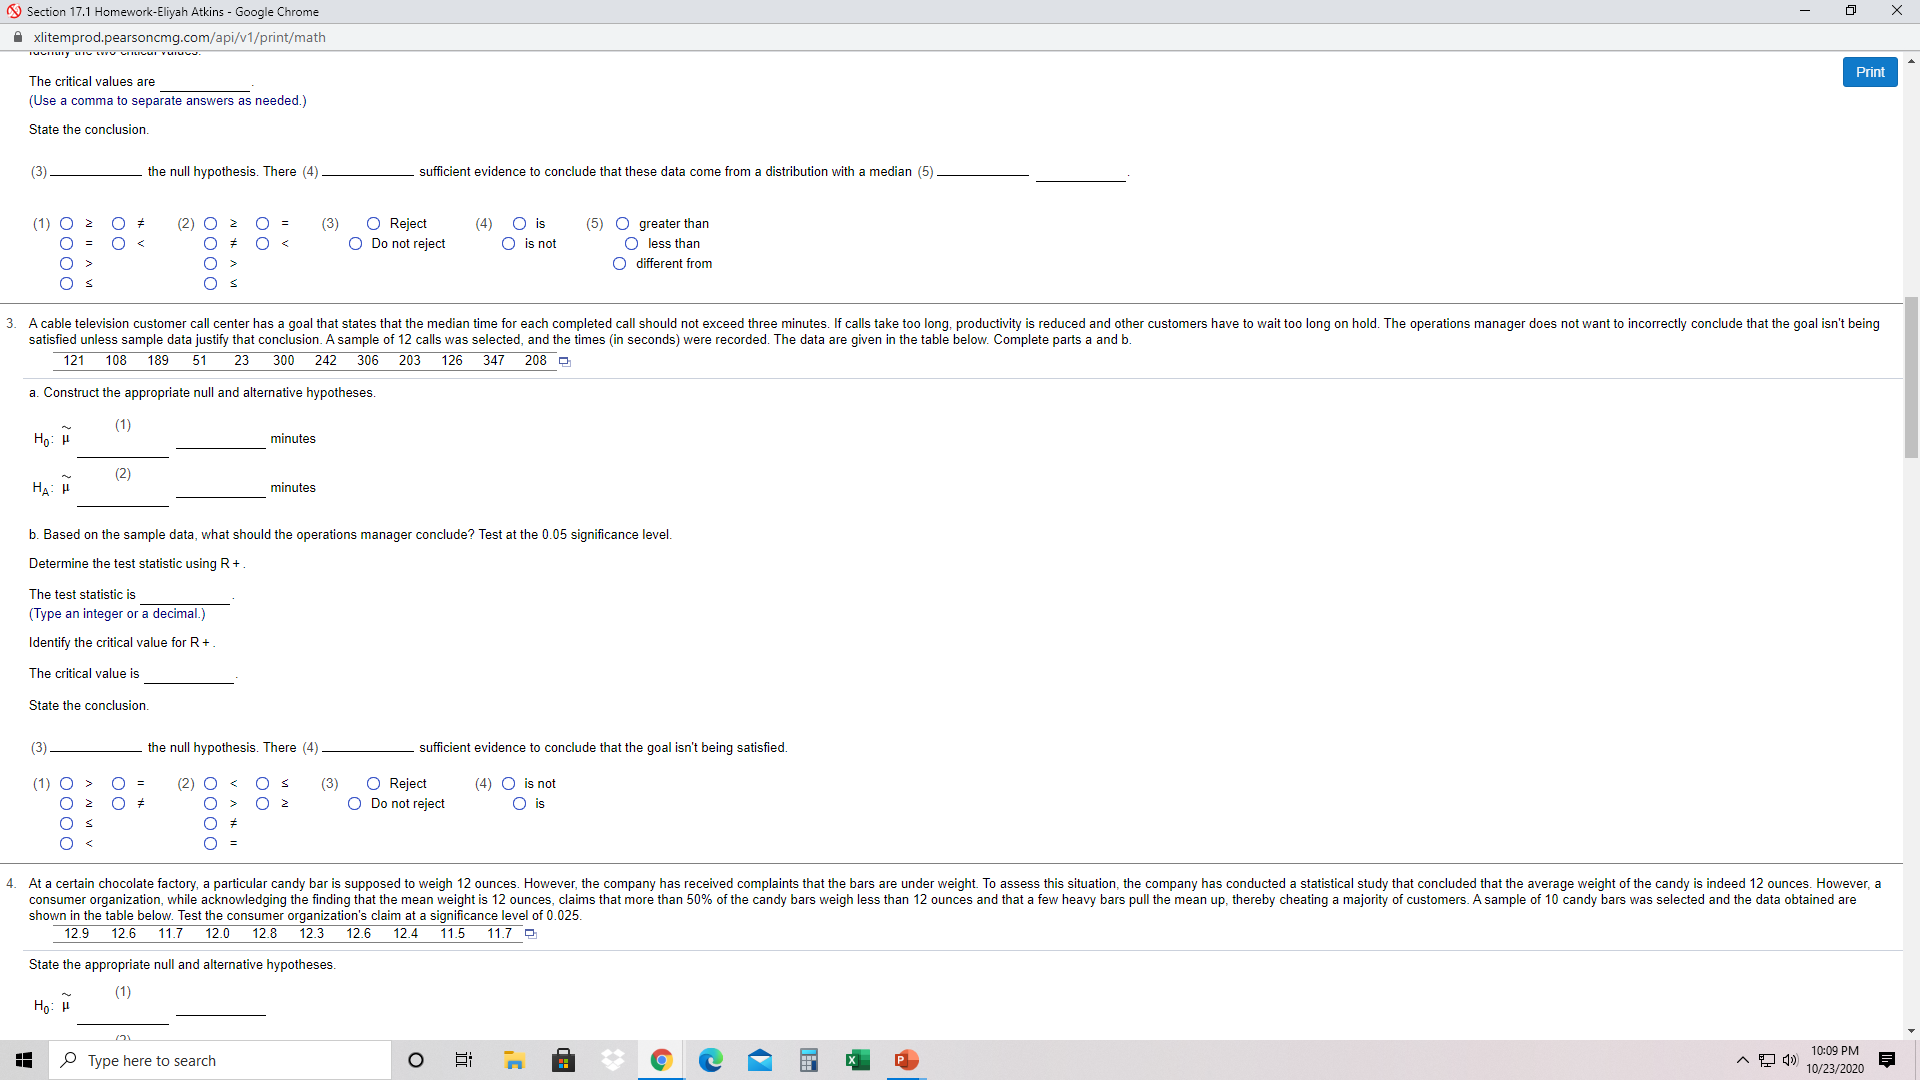
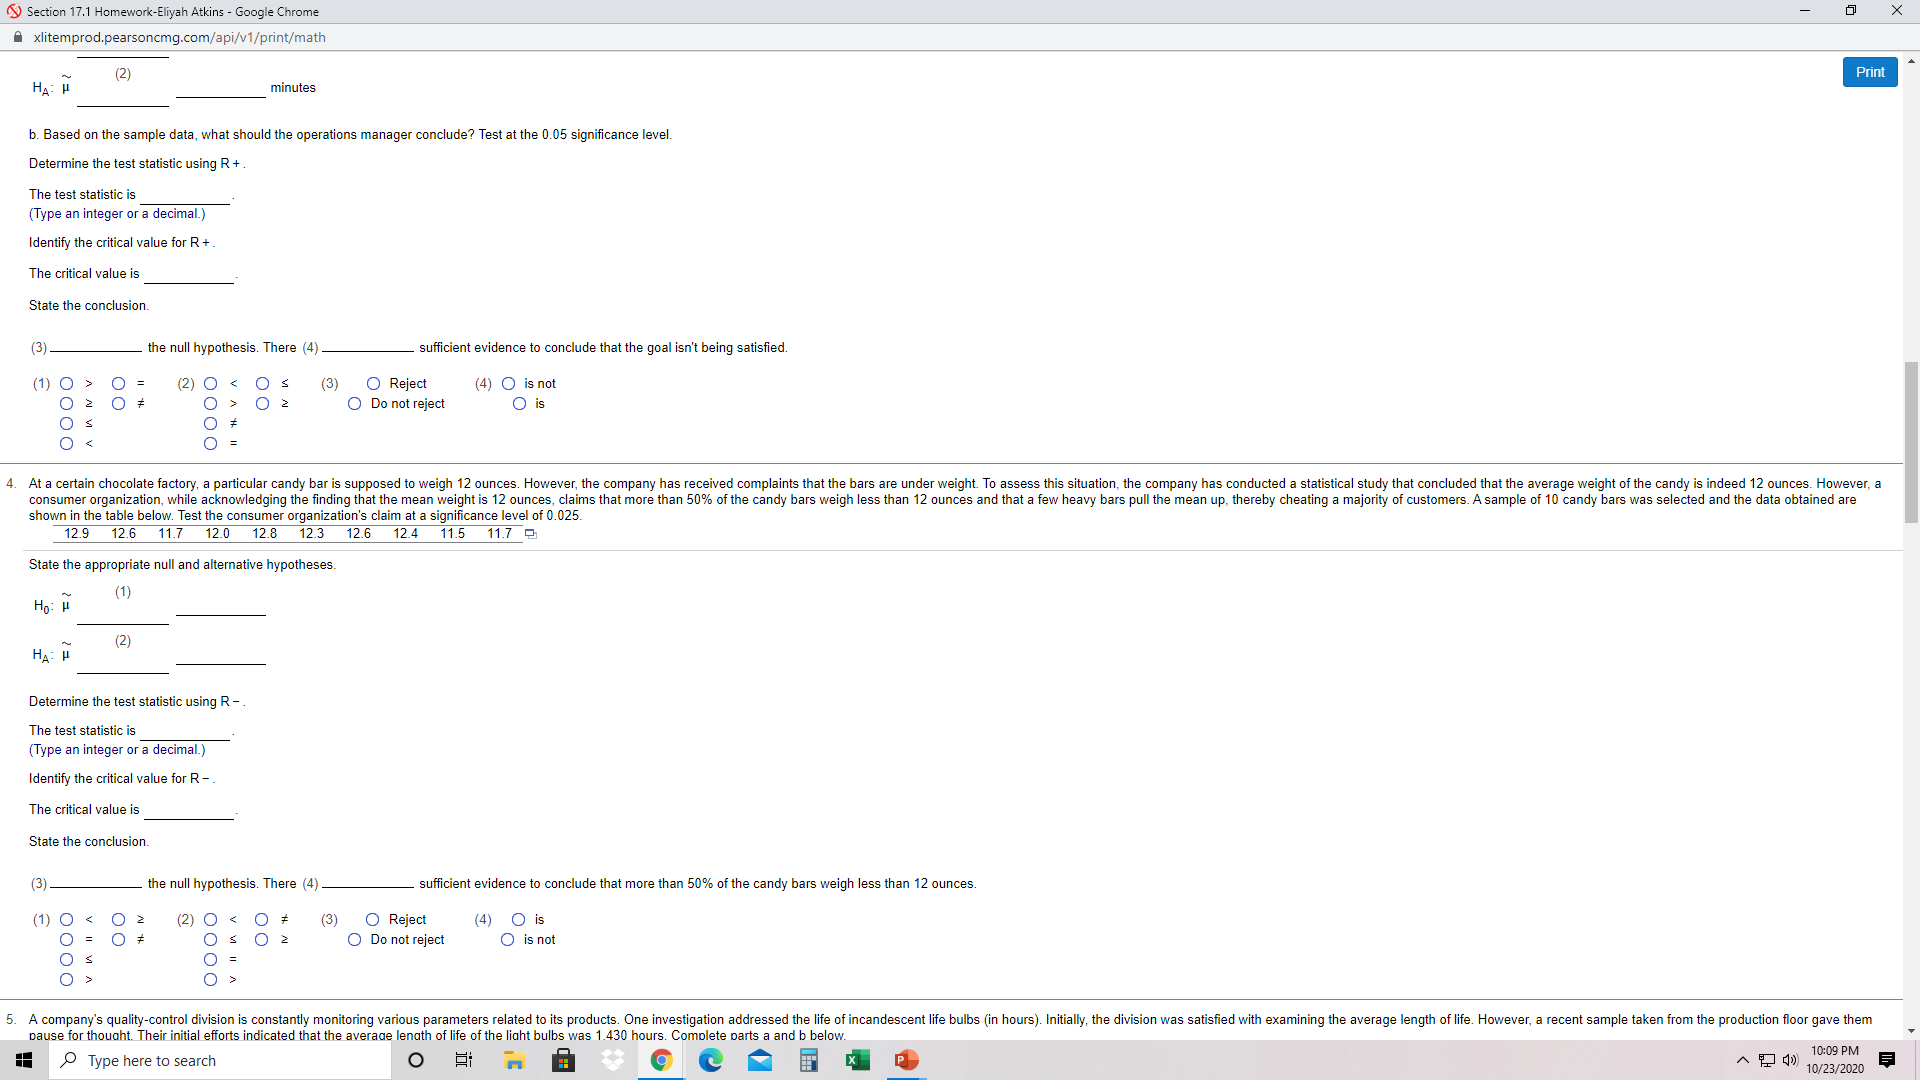
Section 17.1 Homework-Eliyah Atkins - Google Chrome xlitemprod.pearsoncmg.com/api/v1/print/math X Student: Eliyah Atkins Date: 10/23/20 Instructor: Stephen Trouard Course: DAT 473 A Fall 2020 Assignment: Section 17.1 Homework Print 1. Consider the set of observations below. 4.7 5.1 6.3 5 7.9 5.2 3.6 Do not assume these data come from a normal distribution. Test the hypothesis that these data come from a distribution with a median greater than or equal to 6. Use a = 0.05. Click the icon to view the table of critical values W for the Wilcoxon signed-ranks test. State the null and alternative hypotheses for this test. Ho: H HA : H (2) Determine the test statistic. The test statistic is (Type an integer or a decimal.) Identify the critical value(s). (Use a comma to separate answers as needed.) State the conclusion. (3) the null hypothesis. There (4) sufficient evidence to conclude that these data come from a distribution with a median greater than 1: Lower and Upper Critical Values W for Wilcoxon Signed-Ranks Test One-Tailed: a = .05 a = .025 a = .01 = .005 Two-Tailed: a = .10 a = .05 a = .02 a = .01 (Lower, Upper) 0,15 2,19 0,21 3,25 2,26 5,31 0.28 3.33 1.35 8,37 0.36 5,40 10,45 8.47 3,42 1,44 13,53 10,56 5,50 3,52 7.59 17,61 5,61 13,65 21,70 10.68 7.71 17,74 12,79 15 25,80 21,84 10,81 30,90 16.89 25.95 13.92 16 35,101 29.107 16, 104 17 18 41,112 34,119 23,113 19,117 27,126 19 47,124 53,137 40,131 32,139 23,130 20 60,150 46,144 52,158 37,153 27,144 32, 158 43,167 37,173 Type here to search O 10:09 PM ~ () 10/23/2020Section 17.1 Homework-Eliyah Atkins - Google Chrome Axlitemprod.pearsoncmg.com/api/v1/print/math X Do not assume these data come from a normal distribution. Test the hypothesis that these data come from a distribution with a median greater than or equal to 6. Use a = 0.05 Click the icon to view the table of critical values W for the Wilcoxon signed-ranks test. Print State the null and alternative hypotheses for this test. Ho: H (1) (2) Determine the test statistic. The test statistic is (Type an integer or a decimal.) Identify the critical value(s). (Use a comma to separate answers as needed.) State the conclusion. (3 the null hypothesis. There (4) sufficient evidence to conclude that these data come from a distribution with a median greater than 1: Lower and Upper Critical Values W for Wilcoxon Signed-Ranks Test One-Tailed: (2) 0 * Os OO 0 > 02 (3) O Do not reject (4) O is O Reject O is not 0 2 O Reject O is not Print 2 O 2. Consider the set of observations below. 3.8 1 5.1 7.7 8.5 3.6 Do not assume these data come from a normal distribution. Test the hypothesis that these data come from a distribution with a median equal to 5. Use a = 0.05. State the null and alternative hypotheses for this test. Ho: H (1) (2) HA : H Determine the test statistic, using either R + or R -. The test statistic is Type an integer or a decimal.) Identify the two critical values. The critical values are (Use a comma to separate answers as needed.) State the conclusion. (3) the null hypothesis. There (4) sufficient evidence to conclude that these data come from a distribution with a median (5) (1) 0 2 O (2) 0 2 O (3) O Reject O (4) O is O (5) O greater than O O Do not reject O is not O less than O O O different from S 3. A cable television customer call center has a goal that states that the median time for each completed call should not exceed three minutes. If calls take too long, productivity is reduced and other customers have to wait too long on hold. The operations manager does not want to incorrectly conclude that the goal isn't being satisfied unless sample data justify that conclusion. A sample of 12 calls was selected, and the times (in seconds) were recorded. The data are given in the table below. Complete parts a and b. 121 189 23 300 242 306 203 126 347 208 a. Construct the appropriate null and alternative hypotheses. Ho: L minutes (2) HA minutes b. Based on the sample data, what should the operations manager conclude? Test at the 0.05 significance level. Determine the test statistic using R + The test statistic is Type an integer or a decimal.) Type here to search O 10:09 PM ~ () 10/23/2020Section 17.1 Homework-Eliyah Atkins - Google Chrome X xlitemprod.pearsoncmg.com/api/v1/print/math The critical values are Print (Use a comma to separate answers as needed.) State the conclusion. (3) the null hypothesis. There (4) sufficient evidence to conclude that these data come from a distribution with a median (5) (1) 0 2 O Reject O = (2) 0 2 0 (3) (4) O is O Do not reject (5) O greater than O is not O less than O > O O different from 3. A cable television customer call center has a goal that states that the median time for each completed call should not exceed three minutes. If calls take too long, productivity is reduced and other customers have to wait too long on hold. The operations manager does not want to incorrectly conclude that the goal isn't being satisfied unless sample data justify that conclusion. A sample of 12 calls was selected, and the times (in seconds) were recorded. The data are given in the table below. Complete parts a and b. 121 108 189 51 23 300 242 306 203 126 347 208 a. Construct the appropriate null and alternative hypotheses (1) minutes (2 HA: minutes b. Based on the sample data, what should the operations manager conclude? Test at the 0.05 significance level. Determine the test statistic using R + . The test statistic is (Type an integer or a decimal.) Identify the critical value for R + . The critical value is State the conclusion. (3 the null hypothesis. There (4) sufficient evidence to conclude that the goal isn't being satisfied. (1) 0 > O = (2) 0 s (3) O Reject 0 2 (4) O is not O Do not reject O is # 4. At a certain chocolate factory, a particular candy bar is supposed to weigh 12 ounces. However, the company has received complaints that the bars are under weight. To assess this situation, the company has conducted a statistical study that concluded that the average weight of the candy is indeed 12 ounces. However, a consumer organization, while acknowledging the finding that the mean weight is 12 ounces, claims that more than 50% of the candy bars weigh less than 12 ounces and that a few heavy bars pull the mean up, thereby cheating a majority of customers. A sample of 10 candy bars was selected and the data obtained are shown in the table below. Test the consumer organization's claim at a significance level of 0.025 12.9 12.6 11.7 12.0 12.8 12.3 12.6 12.4 11.5 11.7 2 State the appropriate null and alternative hypotheses Type here to search O 10:09 PM A T ( 10/23/2020Section 17.1 Homework-Eliyah Atkins - Google Chrome X xlitemprod.pearsoncmg.com/api/v1/print/math H U (2) Print minutes b. Based on the sample data, what should the operations manager conclude? Test at the 0.05 significance level. Determine the test statistic using R + The test statistic is (Type an integer or a decimal.) Identify the critical value for R + The critical value is State the conclusion. 13 the null hypothesis. There (4) sufficient evidence to conclude that the goal isn't being satisfied. (1) 0 > (3) O (2) 0
Step by Step Solution
There are 3 Steps involved in it

Get step-by-step solutions from verified subject matter experts