

Question: I need help solving the last portion (the vertical analysis). Assume this is a partial list of financial highlights from a Best Buy annual report:
I need help solving the last portion (the vertical analysis).
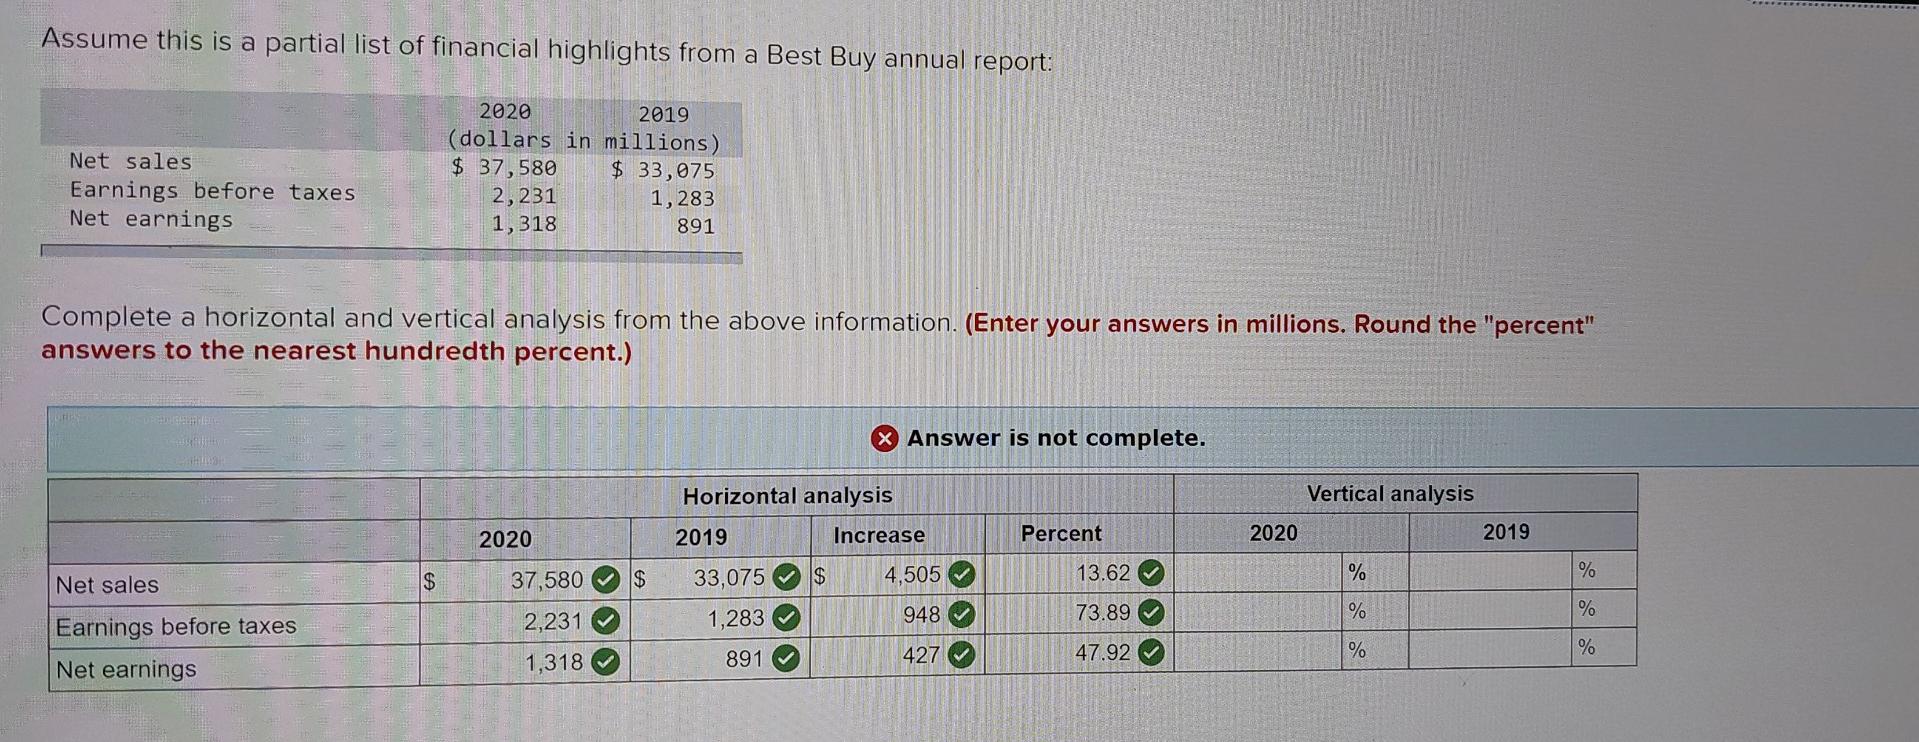
Assume this is a partial list of financial highlights from a Best Buy annual report: Net sales Earnings before taxes Net earnings 2020 2019 (dollars in millions) $ 37,580 $ 33,075 2,231 1,283 1,318 891 Complete a horizontal and vertical analysis from the above information. (Enter your answers in millions. Round the "percent" answers to the nearest hundredth percent.) X Answer is not complete. Horizontal analysis Vertical analysis 2020 2019 2020 2019 Increase Percent $ 37,580 Net sales $ 33,075 $ % 4,505 13.62 % 948 % % > 2,231 73.89 1,283 Earnings before taxes Net earnings 891 427 47.92 > 1,318 % %
Step by Step Solution
There are 3 Steps involved in it

Get step-by-step solutions from verified subject matter experts