

Question: I need help solving these, please! The sample size (n) of this case is For the given data, the x= inches (round your response to
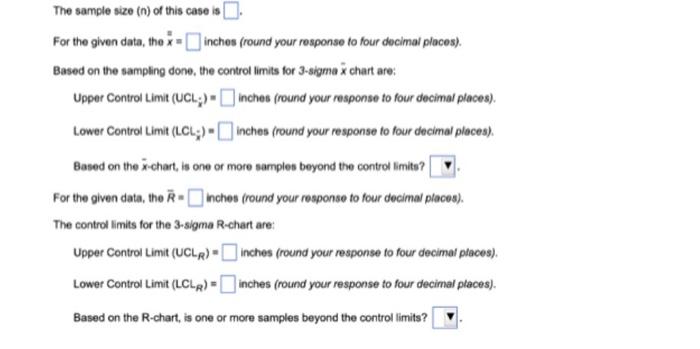
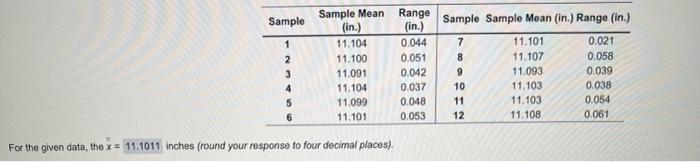
The sample size (n) of this case is For the given data, the x= inches (round your response to four decimal places). Based on the sampling done, the control limits for 3-sigma x chart are: Upper Control Limit (UCL-; = inches (round your response to four decimal places). Lower Control Limit (LCL-) = inches (round your response to four decimal places). Based on the x-chart, is one or more samples beyond the control limits? For the given data, the R= inches (round your response to four decimal places). The control limits for the 3-sigma R-chart are: Lower Control Limit (LCLR)= inches (round your response to four decimal ptaces). Based on the R-chart, is one or more samples beyond the control limits? For the given data, the x=11.1011 inches (round your response to four decimal places)
Step by Step Solution
There are 3 Steps involved in it

Get step-by-step solutions from verified subject matter experts