

Question: I need help solving this problem Table A Areas under the normal curve, 0 to z c. What is your estimate of the mean and
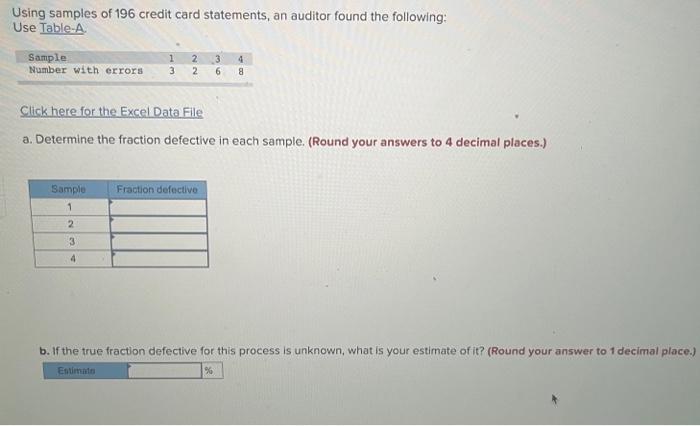
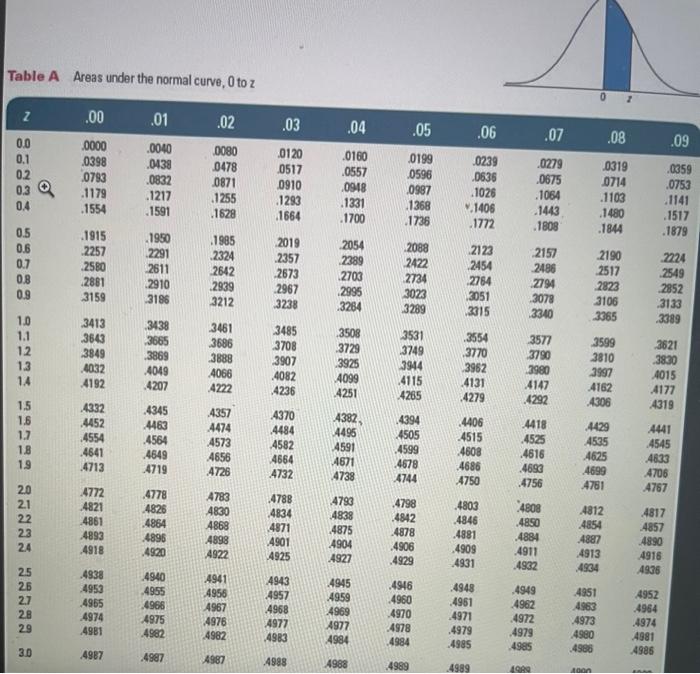
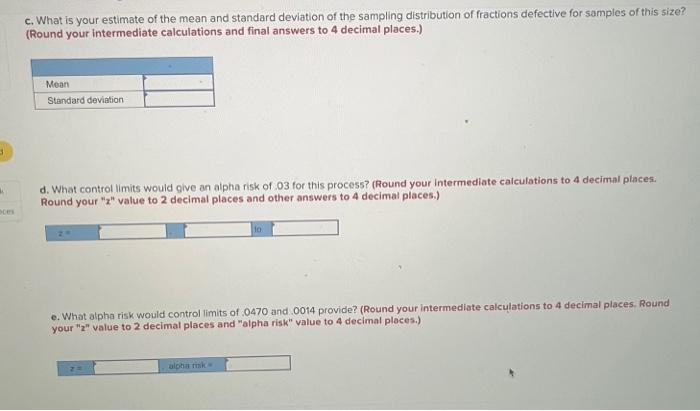
Table A Areas under the normal curve, 0 to z c. What is your estimate of the mean and standard deviation of the sampling distribution of fractions defective for samples of this size? (Round your Intermediate calculations and final answers to 4 decimal places.) d. What control limits would give an alpha risk of .03 for this process? (Round your intermediate calculations to 4 decimal places. Round your " 2 " value to 2 decimal places and other answers to 4 decimal places.) e. What alpha risk would control limits of .0470 and .0014 provide? (Round your intermediate calculations to 4 decimal places. Round your " zn value to 2 decimal places and "alpha risk" value to 4 decimal ploces.) Using samples of 196 credit card statements, an auditor found the following: Use Table-A. Click here for the Excel Data File a. Determine the fraction defective in each sample. (Round your answers to 4 decimal places.) b. If the true fraction defective for this process is unknown, what is your estimate of it? (Round your answer to 1 decimal place.)
Step by Step Solution
There are 3 Steps involved in it

Get step-by-step solutions from verified subject matter experts