

Question: I need help submitting an SPSS data file containing the data from survey administration. fCorrelations Church Attendance Total Understanding Church Attendance Pearson Correlation -.072 Sig.
I need help submitting an SPSS data file containing the data from survey administration.
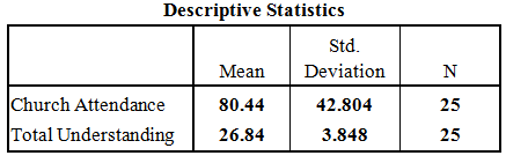
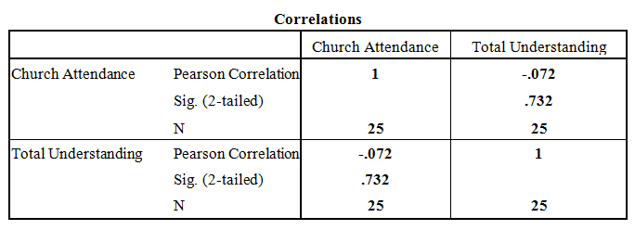
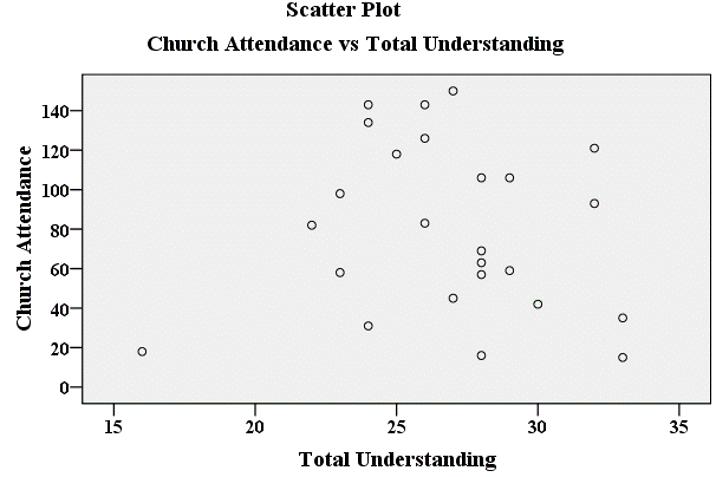
\fCorrelations Church Attendance Total Understanding Church Attendance Pearson Correlation -.072 Sig. (2-tailed) .732 N 25 25 Total Understanding Pearson Correlation -.072 Sig. (2-tailed) .732 N 25 25Scatter Plot Church Attendance vs Total Understanding 140 O O Church Attendance 120 OO O O 100- O O O O 80 O O O 60- O OOO O 40 O O 20 O O O 0 O O 15 20 25 30 Total Understanding 35
Step by Step Solution
There are 3 Steps involved in it
1 Expert Approved Answer
Step: 1 Unlock

Question Has Been Solved by an Expert!
Get step-by-step solutions from verified subject matter experts
Step: 2 Unlock
Step: 3 Unlock