

Question: I need help taking that 8.1 table from the first image and putting the pieces into the excel file (3rd image.) Instructions are in the
I need help taking that 8.1 table from the first image and putting the pieces into the excel file (3rd image.) Instructions are in the second image.
Thanks!
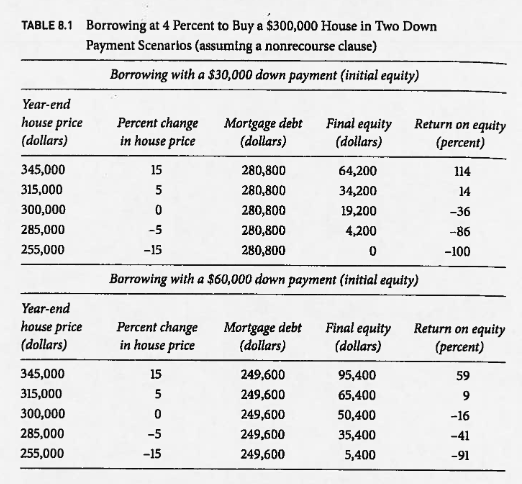
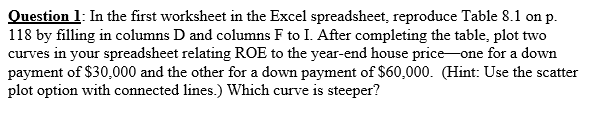
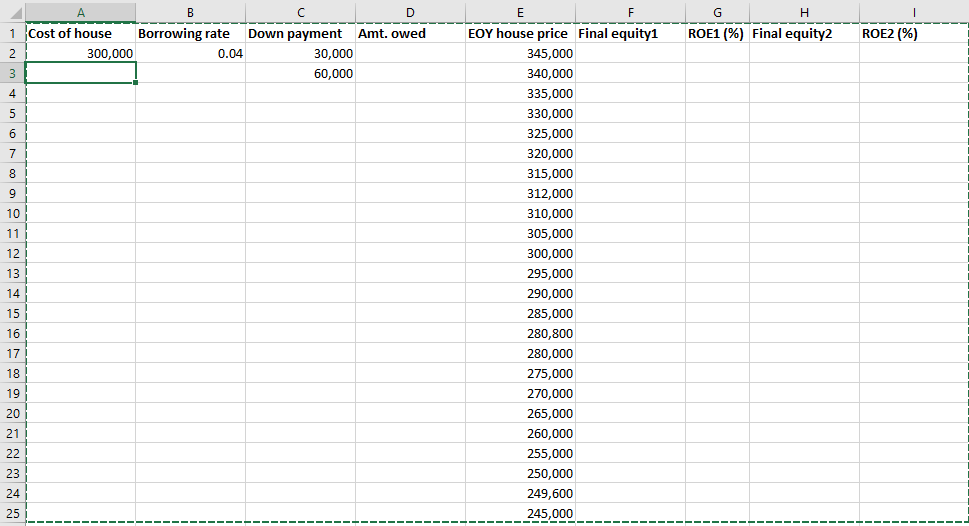
TABLE 8.1 Borrowing at 4 Percent to Buy a $300,000 House in Two Down Payment Scenarios (assuming a nonrecourse clause) Borrowing with a $30,000 down payment initial equity) Year-end house price (dollars) Percent change in house price Mortgage debt (dollars) Final equity (dollars) Return on equity (percent) 345,000 315,000 300,000 285,000 255,000 280,800 280,800 280,800 280,800 280,800 64,200 34,200 19,200 4,200 114 14 -36 -86 -100 Borrowing with a $60,000 down payment (Initial equity) Year-end house price (dollars) Percent change in house price Mortgage debt (dollars) Final equity (dollars) Return on equity (percent) 345,000 315,000 300,000 285,000 255,000 249,600 249,600 249,600 249,600 249,600 95,400 65,400 50,400 35,400 5,400 -16 Question 1: In the first worksheet in the Excel spreadsheet, reproduce Table 8.1 on p. 118 by filling in columns D and columns F to I. After completing the table, plot two curves in your spreadsheet relating ROE to the year-end house price one for a down payment of $30,000 and the other for a down payment of $60,000. (Hint: Use the scatter plot option with connected lines.) Which curve is steeper? D 1 Cost of house Borrowing rate Down payment Amt. owed 2 300,000 0.04 30,000 60,000 G H ROE1 (%) Final equity2 ROE2 (%) EOY house price Final equity1 345,000 340,000 335,000 330,000 325,000 320,000 315,000 312,000 310,000 305,000 300,000 295,000 290,000 285,000 280,800 280,000 275,000 270,000 265,000 260,000 255,000 250,000 249,600 245,000
Step by Step Solution
There are 3 Steps involved in it

Get step-by-step solutions from verified subject matter experts