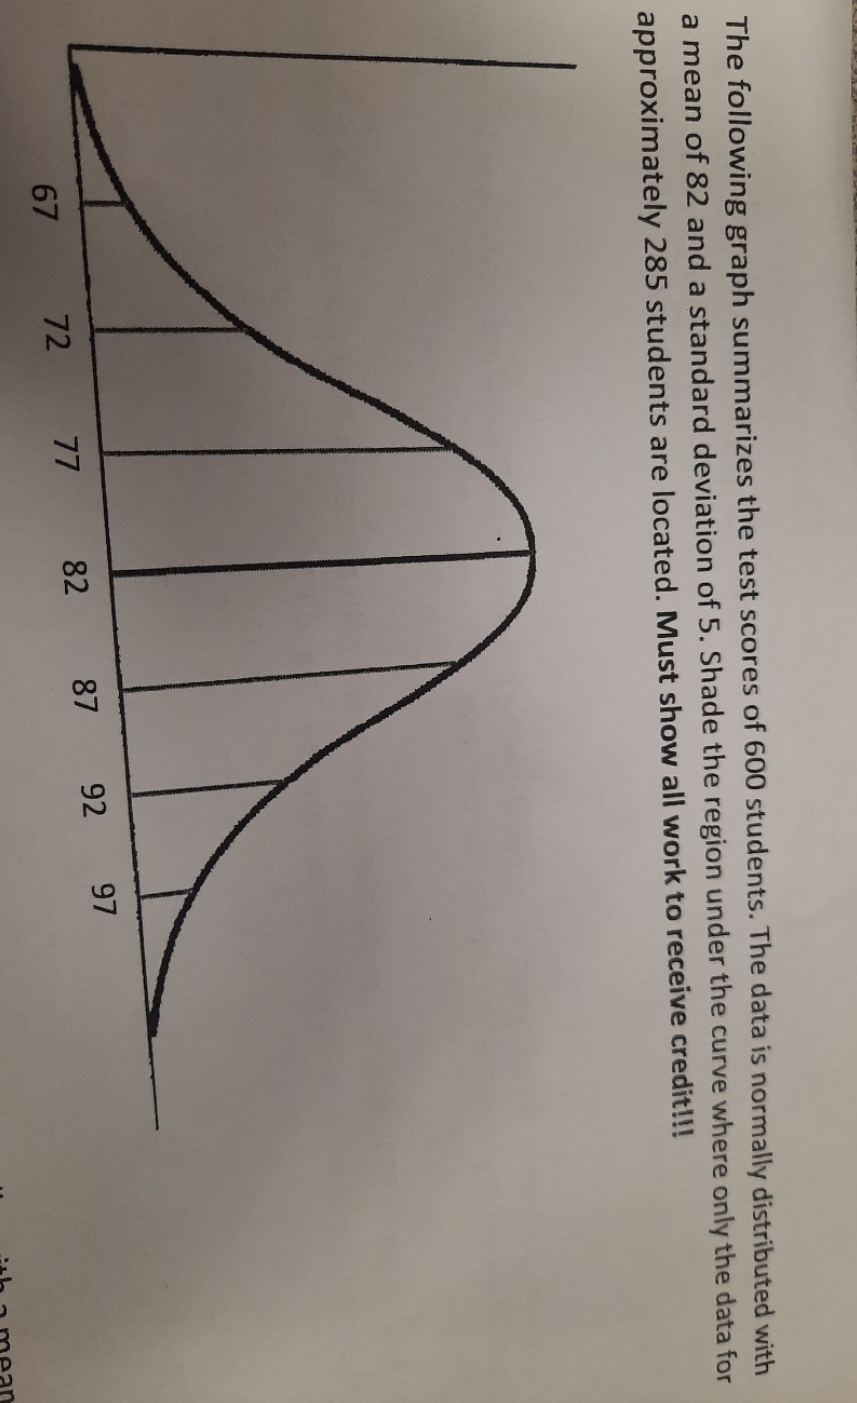
Question: i need help The following graph summarizes the test scores of 600 students. The data is normally distributed with a mean of 82 and a

i need help

i need help The following graph summarizes the
The following graph summarizes the test scores of 600 students. The data is normally distributed with a mean of 82 and a standard deviation of 5. Shade the region under the curve where only the data for approximately 285 students are located. Must show all work to receive credit!!! 00

Step by Step Solution

There are 3 Steps involved in it

1 Expert Approved Answer
Step: 1 Unlock blur-text-image
Question Has Been Solved by an Expert!

Get step-by-step solutions from verified subject matter experts

Step: 2 Unlock
Step: 3 Unlock

Students Have Also Explored These Related Mathematics Questions!