

Question: i need help The graph below is the waiting time in minutes at the emergency room for a random sample of patients. a. The graph
i need help
The graph below is the waiting time in minutes at the emergency room for a random sample of patients.
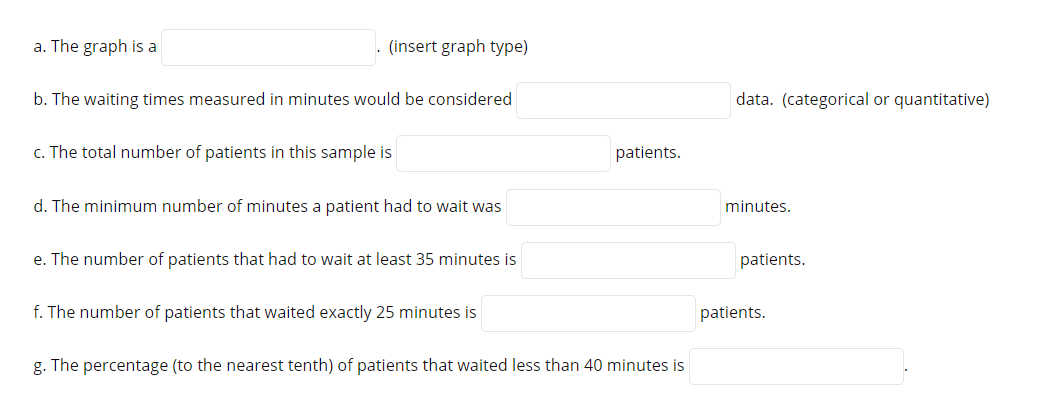
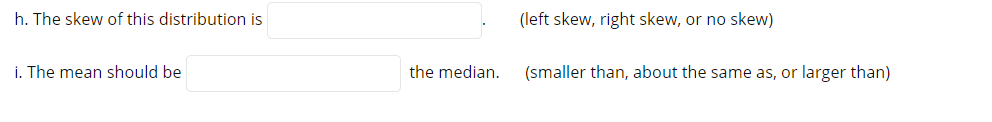
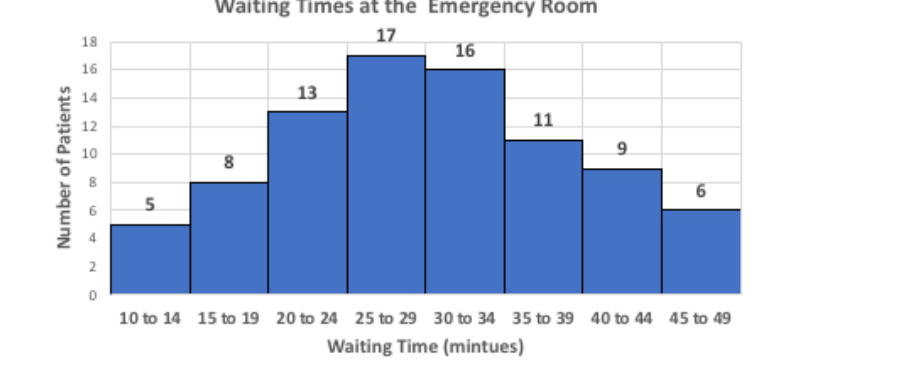
a. The graph is a . [insert graph type) b. The waiting times measured in minutes would be considered data. (categorical or quantitative) c. The total number of patients in this sample is patients. d. The minimum number of minutes a patient had to wait was minutes. e. The number of patients that had to wait at least 35 minutes is patients. f. The number of patients that waited exactly 25 minutes is patients. 3. The percentage (to the nearest tenth) of patients that waited less than 40 minutes is h, The skew ofthis distribution is . [left skew, right skew. or no skew} i. The mean should be the median. (smaller than, about the same as, or larger than) Waiting Times at the Emergency Room 18 17 16 16 13 11 9 Number of Patients 8 ONAROGUE 5 6 10 to 14 15 to 19 20 to 24 25 to 29 30 to 34 35 to 39 40 to 44 45 to 49 Waiting Time (mintues)
Step by Step Solution
There are 3 Steps involved in it

Get step-by-step solutions from verified subject matter experts