

Question: I need help, this is biostatistics 1, and this chart is provided I just have to answer the questions and need help answering and filling

I need help, this is biostatistics 1, and this chart is provided I just have to answer the questions and need help answering and filling out the other charts
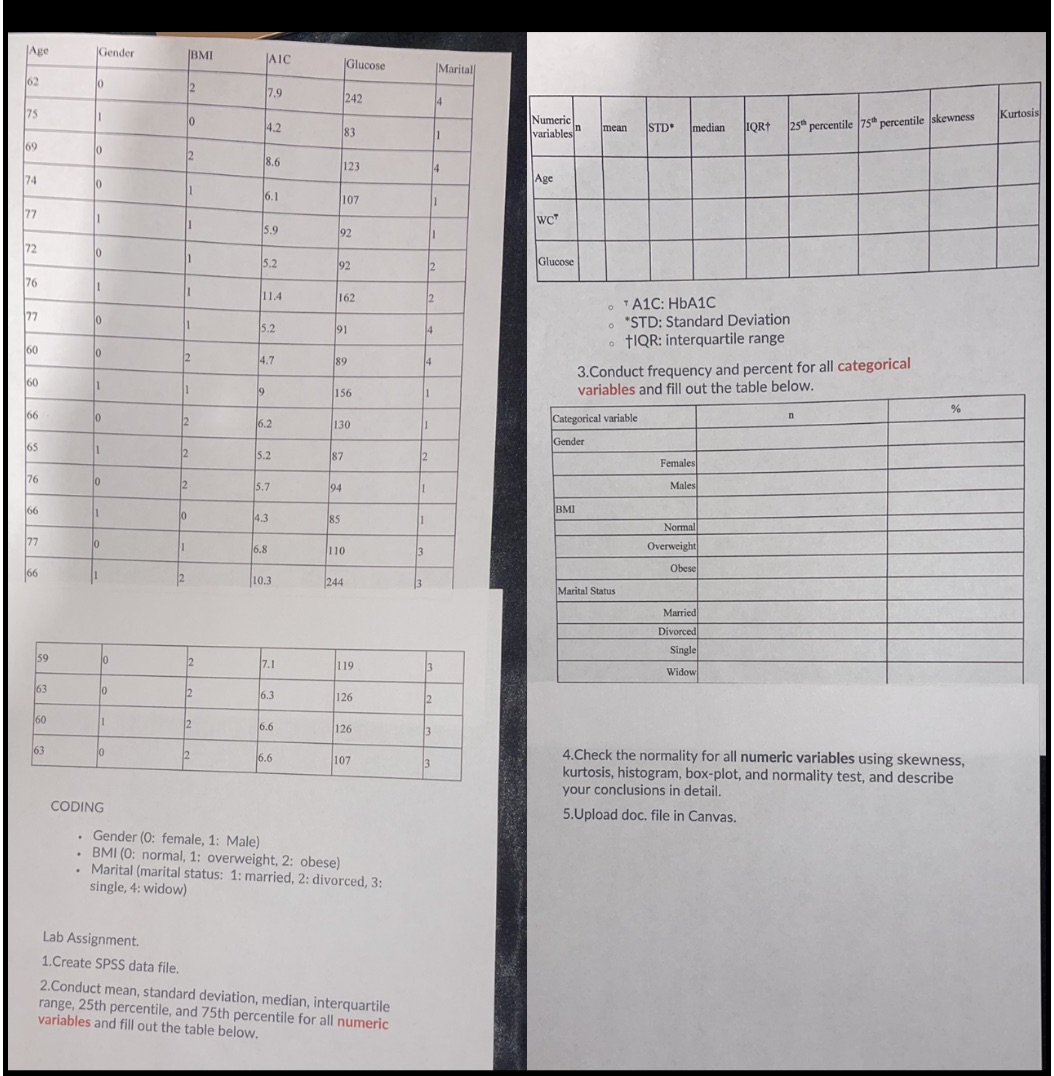
Age Gender BMI AIC Glucose Marital 7.9 242 Kurtosis 75 Numeric 25" percentile 75th percentile skewness 4.2 IORt 83 variables mean STD* median 8.6 123 Age 6.1 107 5.9 92 5.2 92 Glucose 162 TA1C: HbA1C . *STD: Standard Deviation . TIQR: interquartile range 3.Conduct frequency and percent for all categorical 156 variables and fill out the table below. % 6.2 130 Categorical variable Gender 15.2 Females 5.7 Males BMI 14.3 Normal 110 Overweight Obese &T 10.3 1244 Marital Status Married Divorced Single 17.1 119 3 Widow 6.3 126 6.6 126 16.6 107 3 4.Check the normality for all numeric variables using skewness, kurtosis, histogram, box-plot, and normality test, and describe your conclusions in detail. CODING 5.Upload doc. file in Canvas. Gender (0: female, 1: Male) . BMI (0: normal, 1: overweight, 2: obese) . Marital (marital status: 1: married, 2: divorced, 3: single, 4: widow) Lab Assignment. 1. Create SPSS data file. 2.Conduct mean, standard deviation, median, interquartile range, 25th percentile, and 75th percentile for all numeric variables and fill out the table below
Step by Step Solution
There are 3 Steps involved in it

Get step-by-step solutions from verified subject matter experts