

Question: I need help to solve this question... The table below shows demand and supply schedules in the market for eggs, which is presumed to be
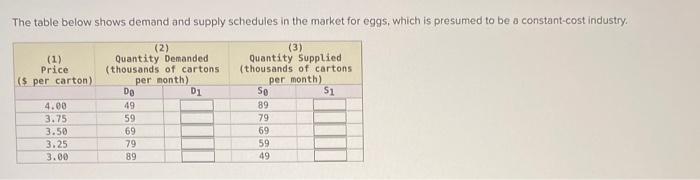
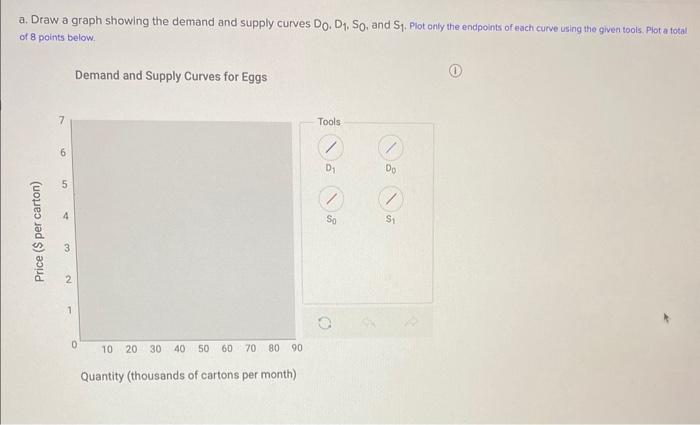
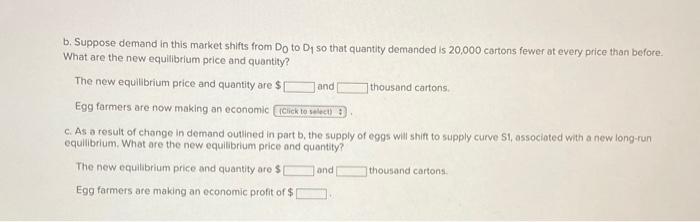
The table below shows demand and supply schedules in the market for eggs, which is presumed to be a constant-cost industry. a. Draw a graph showing the demand and supply curves D0,D1,S0, and S1. Plot only the endpoints of each curve using the given tools, Plot a total of 8 points below. Demand and Supply Curves for Eggs (1) b. Suppose demand in this market shifts from D0 to D1 so that quantity demanded is 20,000 cartons fewer at every price than before What are the new equilibrium price and quantity? The new equilibrium price and quantity are $ and thousand cartons. Egg farmers are now making an economic c. As a result of change in demand outined in part b, the supply of eggs will shift to supply curve S1, associoted with a new long-run equilibrium. What are the new equilbrium price and quantity? The new equilibrium price and quantity are $ and thousand cartons. Egg farmers are making an economic profit of \$
Step by Step Solution
There are 3 Steps involved in it

Get step-by-step solutions from verified subject matter experts