

Question: I need help understanding these problems, I am only allowed to use TI 83 calc I cannot use excel. So if you can use anything
I need help understanding these problems, I am only allowed to use TI 83 calc I cannot use excel. So if you can use anything on TI 83 please show me. I need A,B,C,D answered and I will upvote, Thanks!
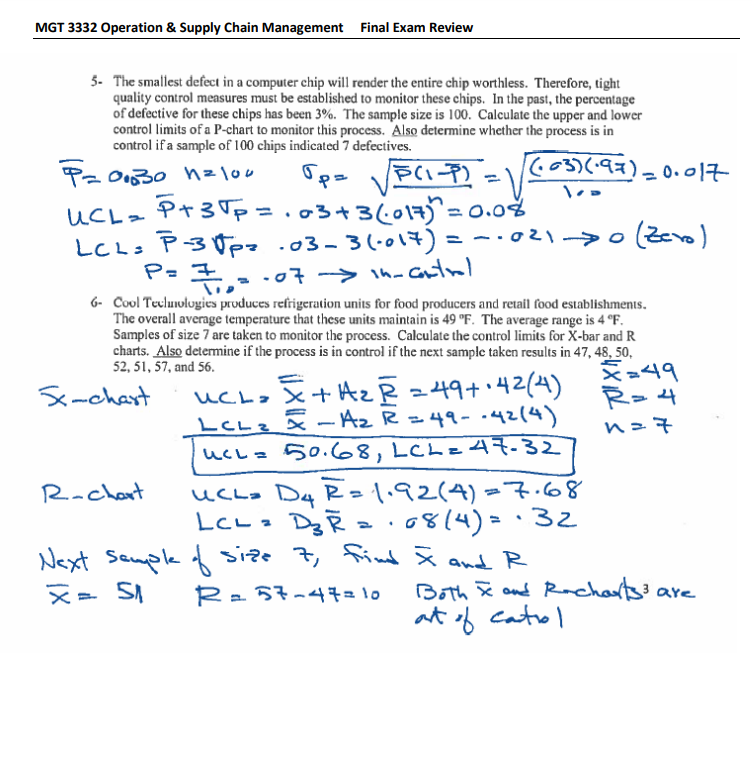
5. The smallest defect in a computer chip will render the entire chip worthless. Therefore, tight quality control measures must be established to monitor these chips. In the past, the percentage of defective for these chips has been 3%. The sample size is 100 . Calculate the upper and lower control limits of a P-chart to monitor this process. Also determine whether the process is in 6. Cool Tecluolugies produces refrigeration units for food producers and retail food establishments. The overall average temperature that these units maintain is 49F. The average range is 4F. Samples of size 7 are taken to monitor the process. Calculate the control limits for X-bar and R charts. Also determine if the process is in control if the next sample taken results in 47,48,50, 52,51,57, and 56
Step by Step Solution
There are 3 Steps involved in it

Get step-by-step solutions from verified subject matter experts