

Question: I need help understanding this question and how my professor got this answer. I also need help with the R code that was used in
I need help understanding this question and how my professor got this answer.
I also need help with the R code that was used in the example.
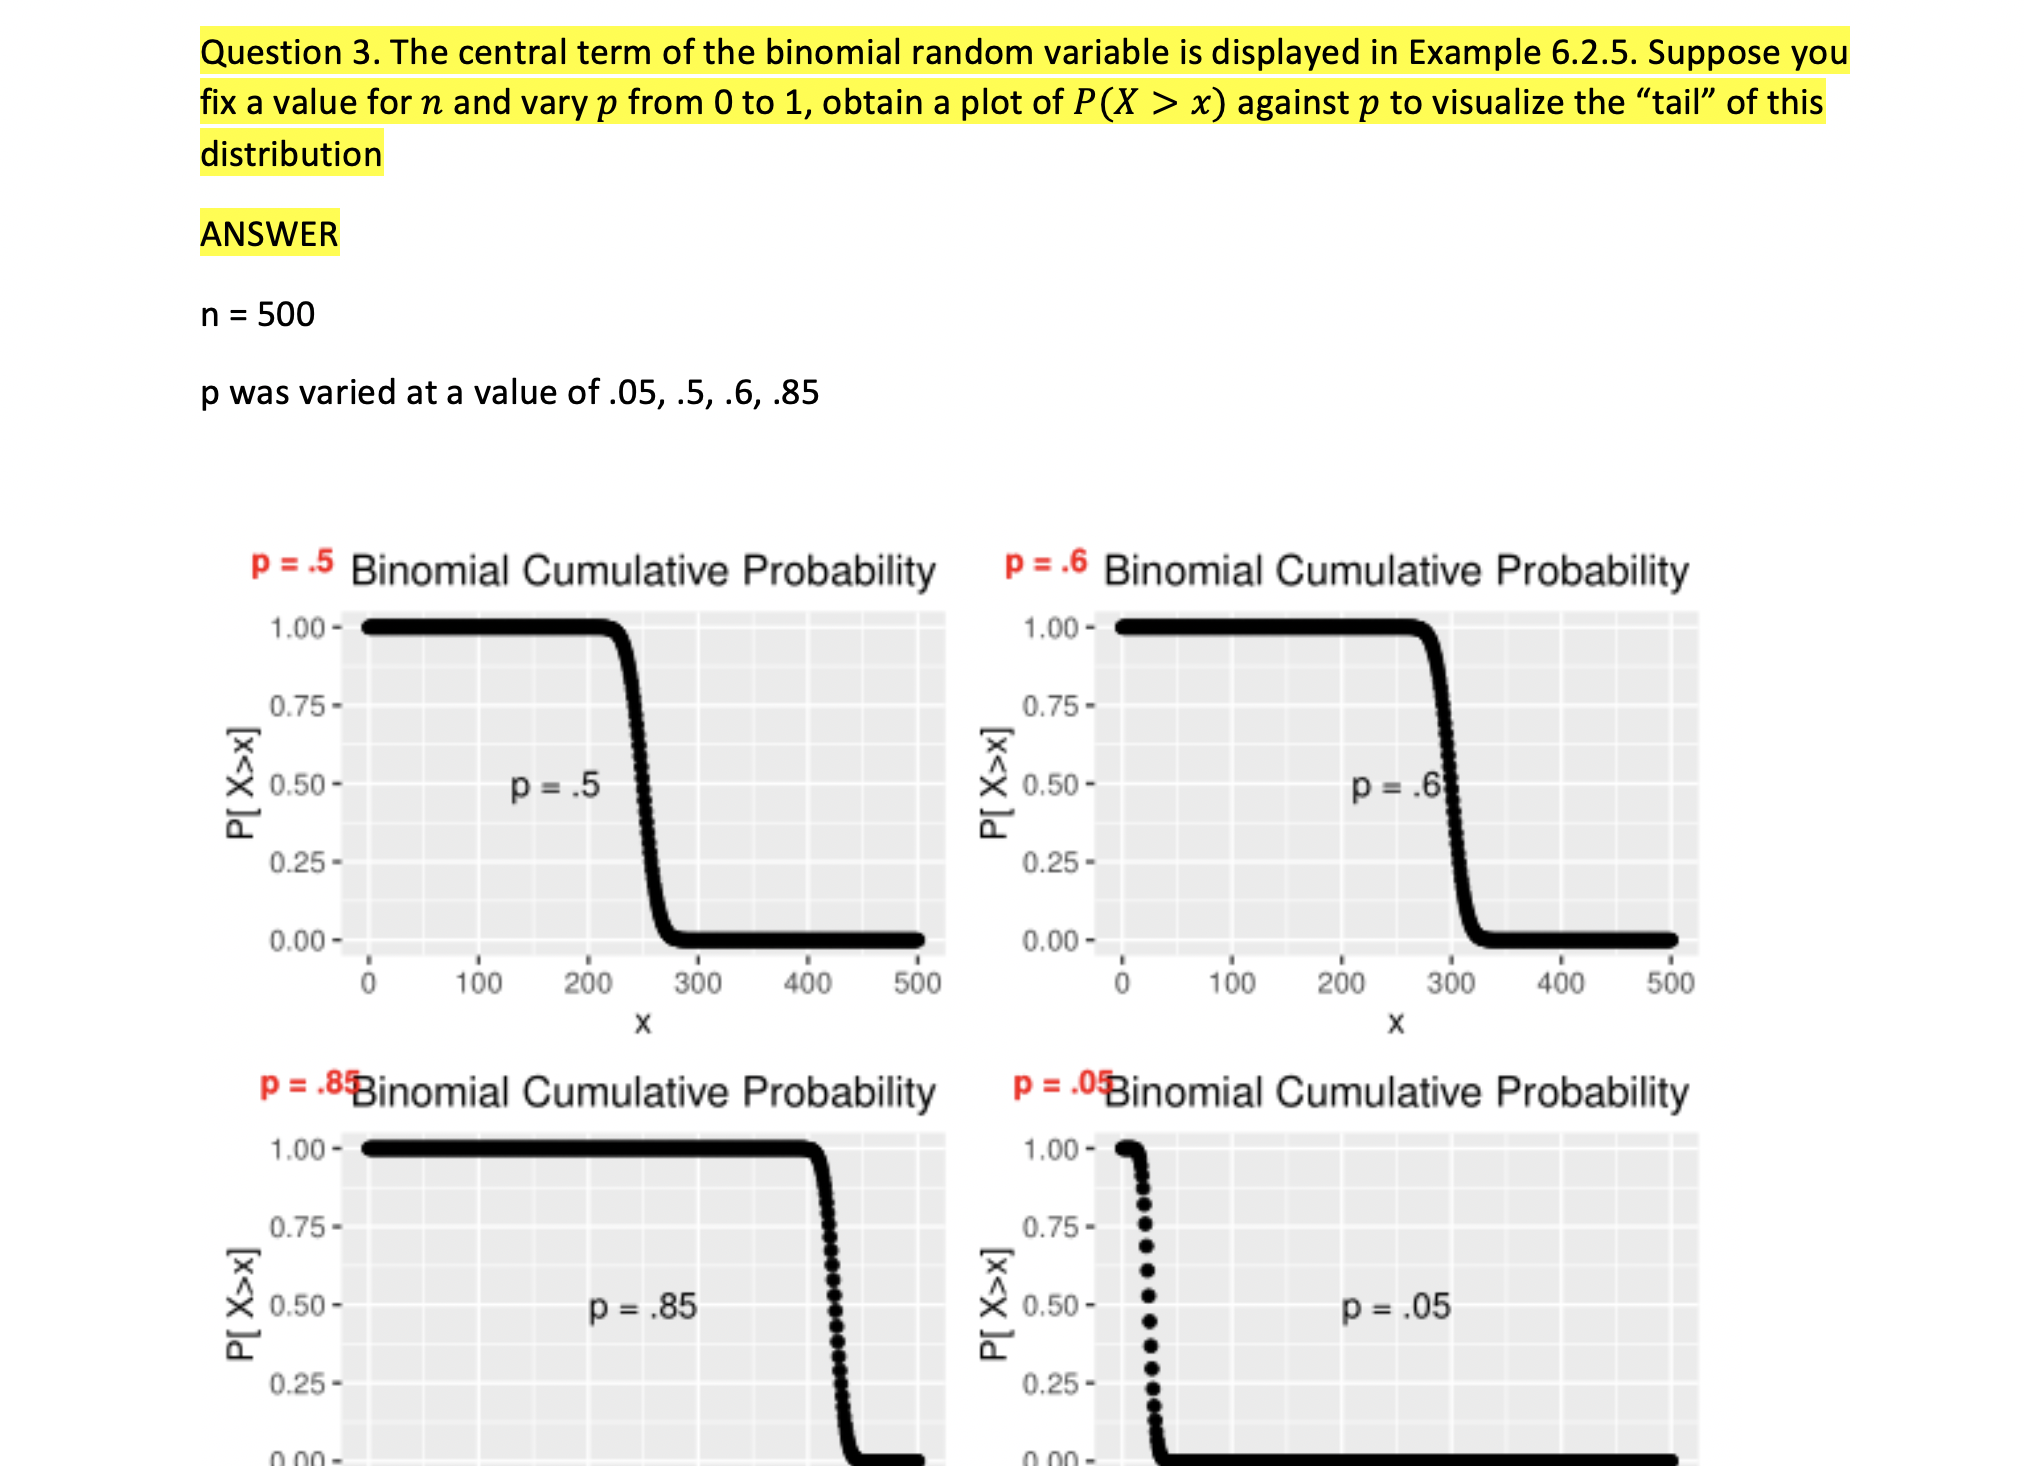
Question 3. The central term of the binomial random variable is displayed in Example 6.2.5. Suppose you fix a value for n and vary p from 0 to 1, obtain a plot of P(X > x) against p to visualize the "tail" of this distribution ANSWER n = 500 p was varied at a value of .05, .5, .6, .85 P = .5 Binomial Cumulative Probability P = .6 Binomial Cumulative Probability 1.00 - 1.00 - 0.75 - 0.75- PIX>X] 0.50- p =.5 PIX>x] 0.50 P =.6 0.25 - 0.25 - 0.00 - 0.00 - 0 100 200 300 400 500 0 100 200 300 400 500 X X p = .8Binomial Cumulative Probability P = .Binomial Cumulative Probability 1.00 - 1.00 - 0.75 - 0.75 - PIX>X] 0.50 - P =.85 PIX>x] . ... 0.50 - P =.05 0.25 - 0.25 -
Step by Step Solution
There are 3 Steps involved in it

Get step-by-step solutions from verified subject matter experts