

Question: I need help using the MATLAB code above to answer the questions in my lab. Q2. MTALAB (30 points) Study and use the given MATLAB

I need help using the MATLAB code above to answer the questions in my lab.
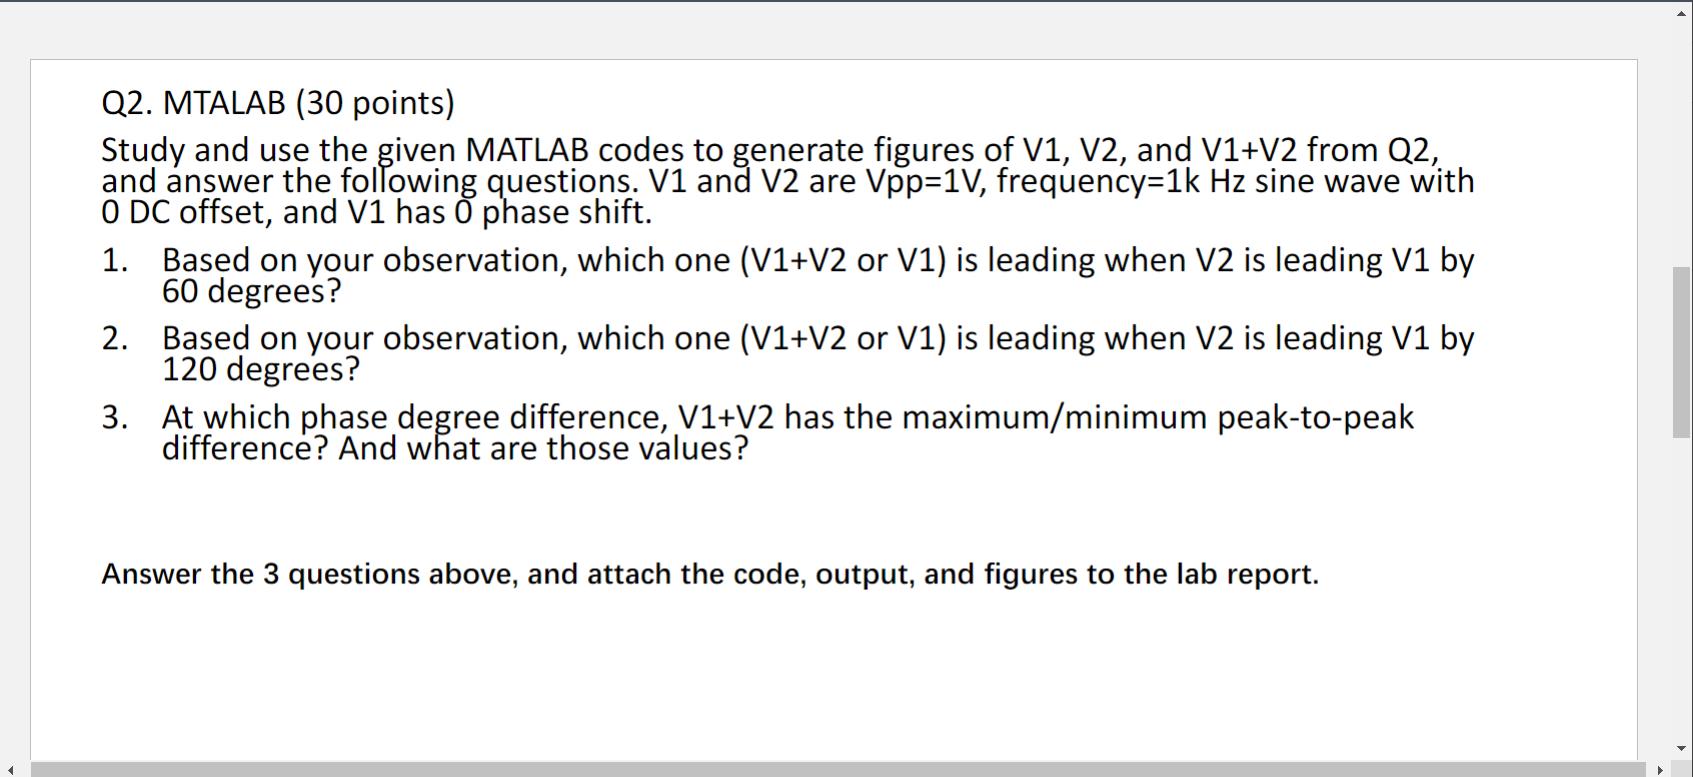
Q2. MTALAB (30 points) Study and use the given MATLAB codes to generate figures of V1, V2, and V1+V2 from Q2, and answer the following questions. V1 and V2 are Vpp=1V, frequency=1k Hz sine wave with O DC offset, and V1 has 0 phase shift. 1. Based on your observation, which one (V1+V2 or V1) is leading when V2 is leading V1 by 60 degrees? 2. Based on your observation, which one (V1+V2 or V1) is leading when V2 is leading V1 by 120 degrees? 3. At which phase degree difference, V1+V2 has the maximum/minimum peak-to-peak difference? And what are those values? Answer the 3 questions above, and attach the code, output, and figures to the lab report.
Step by Step Solution
There are 3 Steps involved in it

Get step-by-step solutions from verified subject matter experts