

Question: I need help with 5-7 A manager is concerned that overtime (measured in hours) is contributing to more sickness (measured in sick days) among the
I need help with 5-7
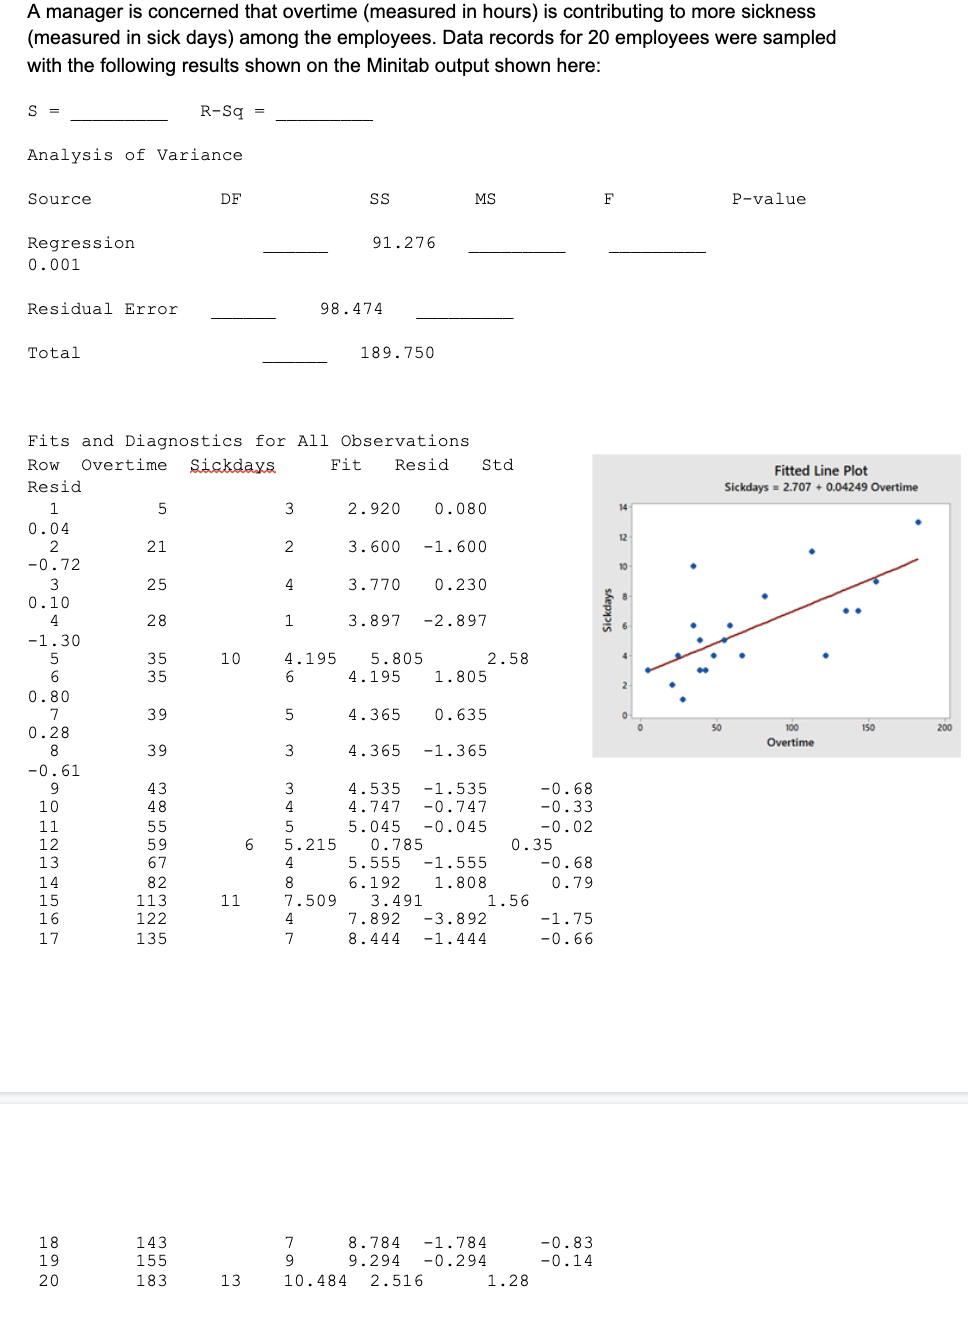
A manager is concerned that overtime (measured in hours) is contributing to more sickness (measured in sick days) among the employees. Data records for 20 employees were sampled with the following results shown on the Minitab output shown here: S = R-Sq = Analysis of Variance Source DF SS MS F P-value Regression 91 . 276 0 . 001 Residual Error 98. 474 Total 189 . 750 Fits and Diagnostics for All Observations Row Overtime Sickdays Fit Resid Std Fitted Line Plot Resid Sickdays = 2.707 + 0.04249 Overtime 1 5 3 2. 920 0. 080 14 0 . 04 2 21 2 3. 600 -1. 600 -0.72 10 3 25 3. 770 0. 230 0. 10 4 28 3. 897 -2.897 Sickday 8 6 -1. 30 35 10 4. 195 5. 805 2 . 58 6 35 6 1. 195 1. 805 0 . 80 7 39 4. 365 0. 635 0 . 28 50 100 150 200 8 39 W 4.365 -1.365 Overtime -0 . 61 9 43 4. 535 -1.535 -0. 68 LO 48 4. 747 -0.747 -0.33 11 5. 045 -0. 045 -0. 02 12 55 59 6 5. 215 0. 785 0. 35 13 67 5 . 555 -1. 555 -0. 68 14 82 6. 192 1. 808 0 . 79 16 113 122 11 JD JOO DUUAW 7.509 3. 491 1 . 56 -1. 75 17 135 7. 892 -3.892 8 . 444 -1. 444 -0. 66 18 19 143 8 . 784 -1. 784 -0.83 155 9. 294 -0. 294 -0.14 20 183 13 10 -J 10. 484 2.516 1. 285. Find and interpret the r, coefficient of determination. (Blank Line) 6. Find the estimate of standard deviation of the residual error. (Blank Line) 7. Identify any residual that is more than two standard deviations from the regression line. Verify by looking at the scatterplot
Step by Step Solution
There are 3 Steps involved in it

Get step-by-step solutions from verified subject matter experts