

Question: I will attach the scatterplot for G) as extra notes. Any help is greatly appreciated! l. A manager is concerned that overtime (measured in hours)
I will attach the scatterplot for G) as extra notes. Any help is greatly appreciated!
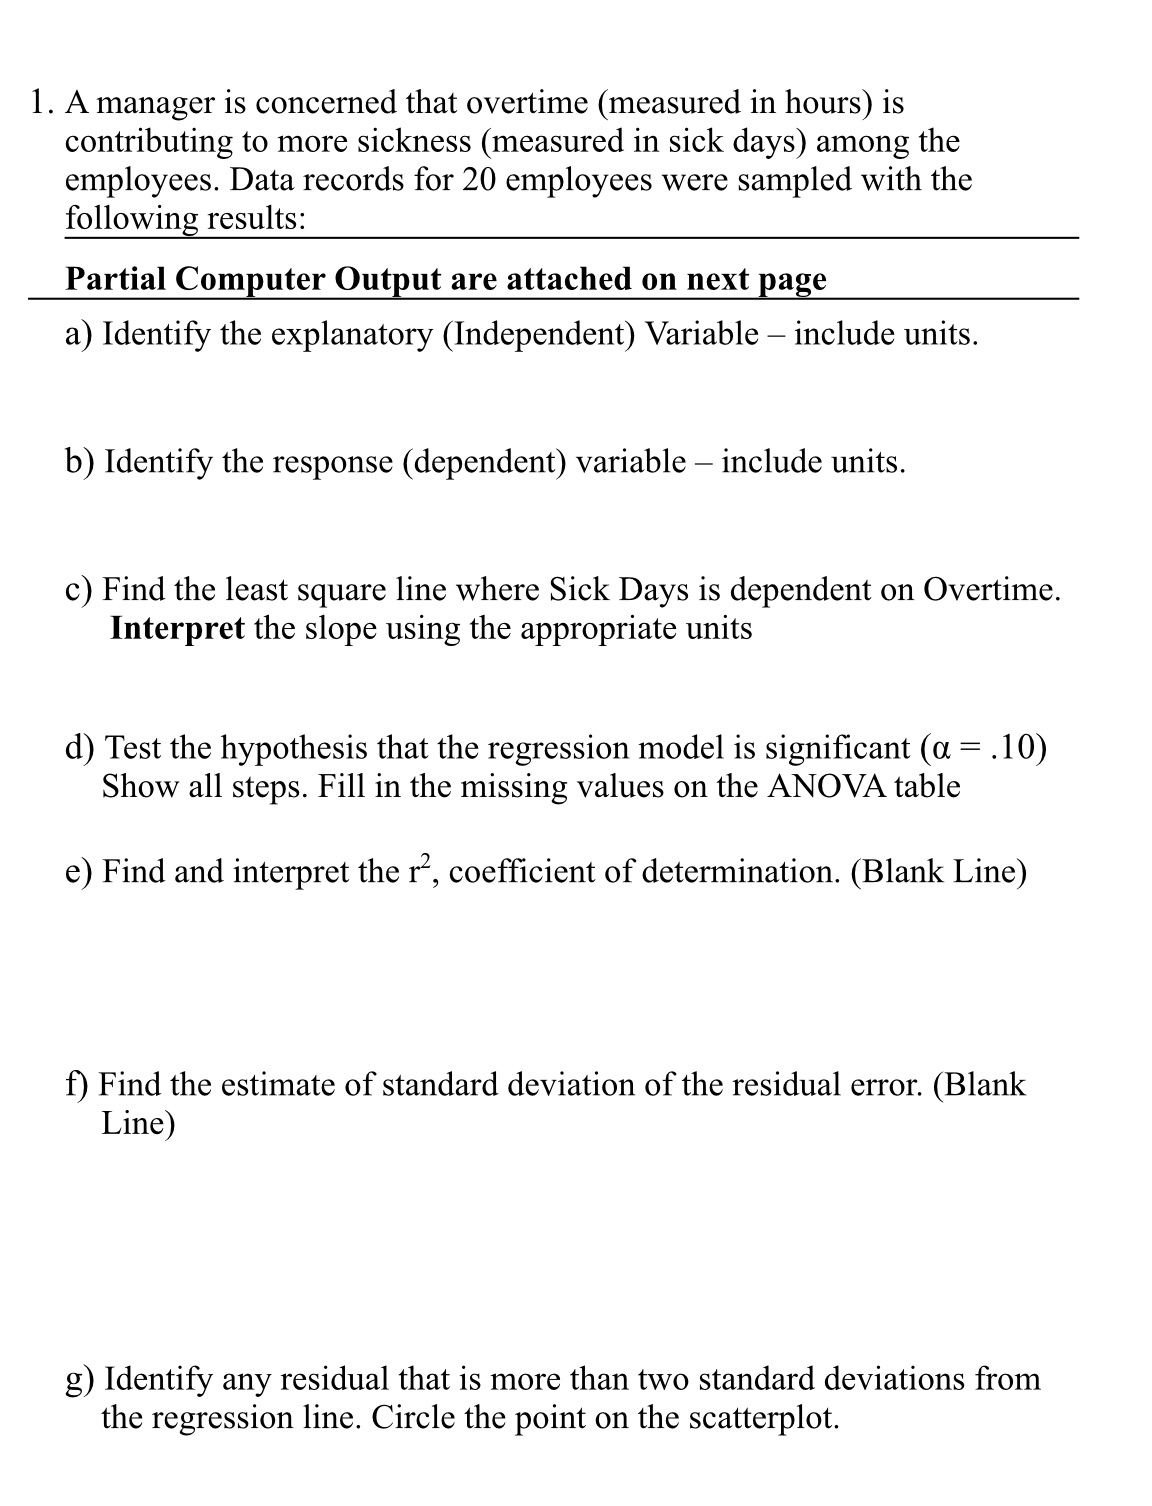
l. A manager is concerned that overtime (measured in hours) is contributing to more sickness (measured in sick days) among the employees. Data records for 20 employees were sampled with the following results: Partial Computer Output are attached on next page a) Identify the explanatory (Independent) Variable include units. b) Identify the response (dependent) variable include units. c) Find the least square line where Sick Days is dependent on Overtime. Interpret the slope using the appropriate units (1) Test the hypothesis that the regression model is signicant (01 = .10) Show all steps. Fill in the missing values on the ANOVA table c) Find and interpret the r2, coefcient of determination. (Blank Line) f) Find the estimate of standard deviation of the residual error. (Blank Line) g) Identify any residual that is more than two standard deviations from the regression line. Circle the point on the scatterplot
Step by Step Solution
There are 3 Steps involved in it

Get step-by-step solutions from verified subject matter experts