Question: I need help with 8 and 14 I have attached the problem and data table also provide screen shots of course hero answers examples to
I need help with 8 and 14
I have attached the problem and data table also provide screen shots of course hero answers examples to help there 2 problems
1-7 answers by a Course hero Tutors and 9-15 answer also by Couse Hero tutor
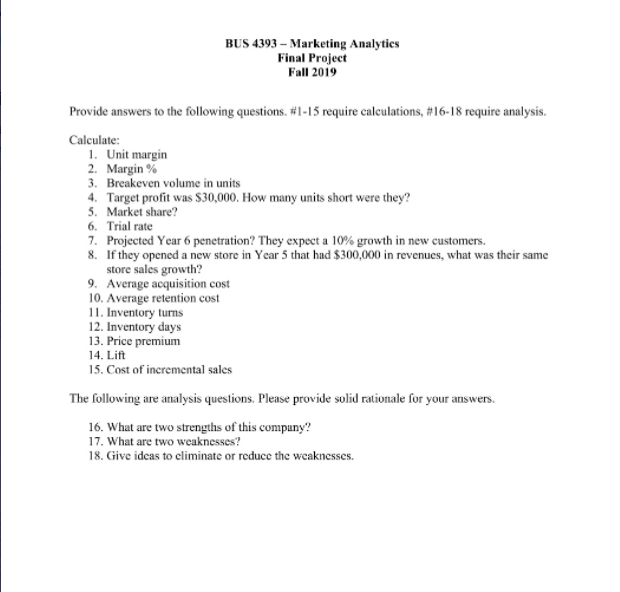
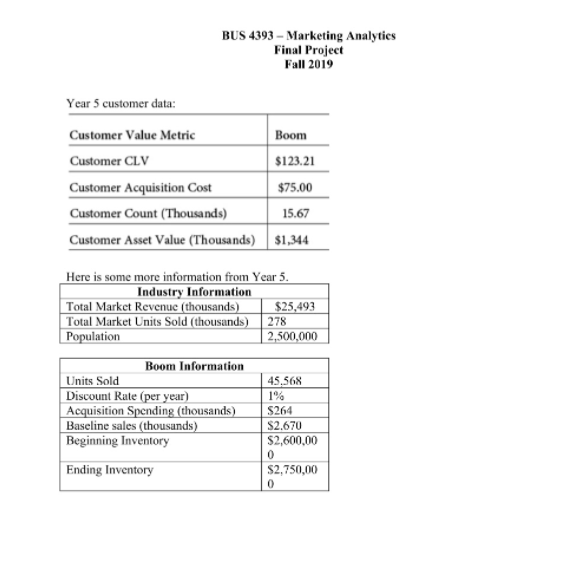
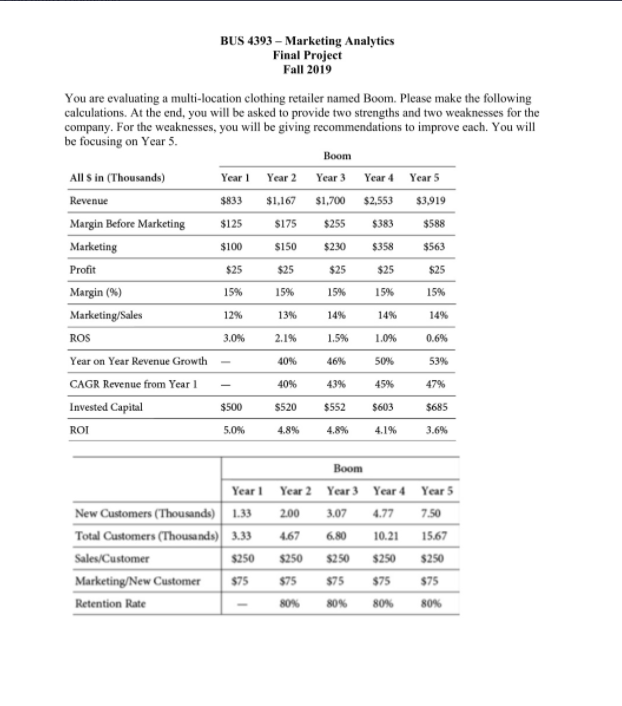
BUS 4393 - Marketing Analytics Final Project Fall 2019 Provide answers to the following questions. #1-15 require calculations, #16-18 require analysis. Calculate: 1. Unit margin 2. Margin % 3. Breakeven volume in units 4. Target profit was $30,000. How many units short were they? 5. Market share? 6. Trial rate 7. Projected Year 6 penetration? They expect a 10% growth in new customers. 8. If they opened a new store in Year 5 that had $300,000 in revenues, what was their same store sales growth? 9. Average acquisition cost 10. Average retention cost 11. Inventory turns 12. Inventory days 13. Price premium 14. Lift 15. Cost of incremental sales The following are analysis questions. Please provide solid rationale for your answers. 16. What are two strengths of this company? 17. What are two weaknesses! 18. Give ideas to eliminate or reduce the weaknesses.BUS 4393 - Marketing Analytics Final Project Fall 2019 Year 5 customer data: Customer Value Metric Boom Customer CLV $123.21 Customer Acquisition Cost $75.00 Customer Count (Thousands) 15.67 Customer Asset Value (Thousands) $1,344 Here is some more information from Year 5 Industry Information Total Market Revenue (thousands) $25,493 Total Market Units Sold (thousands) 278 Population 2,500,000 Boom Information Units Sold 45.568 Discount Rate (per year) 1% Acquisition Spending (thousands) $264 Baseline sales (thousands) $2.670 Beginning Inventory $2,600,00 0 Ending Inventory $2,750,00BUS 4393 - Marketing Analytics Final Project Fall 2019 You are evaluating a multi-location clothing retailer named Boom. Please make the following calculations. At the end, you will be asked to provide two strengths and two weaknesses for the company. For the weaknesses, you will be giving recommendations to improve each. You will be focusing on Year 5. Boom All $ in (Thousands) Year 1 Year 2 Year 3 Year 4 Year 5 Revenue $833 $1.167 $1,700 $2.553 $3,919 Margin Before Marketing $125 $175 255 $383 $588 Marketing $100 $150 $230 $358 3563 Profit $25 $25 $25 $25 Margin (%) 15% 156 15% Marketing/Sales 12% 13%% 14%% 14% 149% ROS 3.0% 2.1% 1.5% 1.06 0.6% Year on Year Revenue Growth 10% 46%% 50%% CAGR Revenue from Year 1 40% 43% 47% Invested Capital $500 $520 $552 $603 $685 ROI 4.8%% 4.8% 4.1% 3.6% Boom Year 1 Year 2 Year 3 Year 4 Year 5 New Customers (Thousands) 1.33 200 3.07 4.77 7.50 Total Customers (Thousands) 3.33 167 5.80 10.21 15.67 Sales/Customer 1250 $250 $250 $250 $250 Marketing/New Customer $75 $75 $75 $75 $75 Retention Rate 8ON 80% 8ON 80%Units sold by BOOM in year 5 = 45,568 Year 5 Revenue = $3,919,000 Year 5 Margin before marketing = $588,000 Sales price per unit = 3919000/45568 = $86 Margin per unit = 588000/45568 = $12.903 .. Answer 1 Margin% = 588000 / 3919000 = 12.903 / 86 = 15.0% Answer 2 For Year 5 Break even analysis: Fixed cost = marketing cost = $ 563,000 Revenue - Variable Cost = Margin before marketing = $ 588,000 (Revenue - Variable Cost) Per Unit = Margin per unit = $12.903 Hence, Break even quantity can be calculated as = 563,000 / 12.903 = 43,631 .. Answer 3 For a target of $30,000, Units to be produced = (563,000 + 30,000) / 12.903 = 45,955 units Units shortage for the profit of $30,000 = 45955 - 45568 = 387 units ...... Answer 4 Total market units sold = 278,000 Total market revenue = $25,493,000 Market share wit. units sold = Units sold by BOOM / Total market units = 45568 / 278000 = 16.39% wememos Answer 5 Market share wirt. value = Revenue by BOOM / Total market revenue = 3919000 / 25493000 =15.37% .... ...... Answer 5 Total Customers of BOOM = 15,670 Population = 2,500,000 Trial rate = 15670 / 2500000 = 0.6268% ..... Answer 6Year 5 New Customers = 7500 Expected Year 6 new customers = 7500 + (10% * 7500) = 8250 customers Expected year 6 total customers = year 5 retained customers + year 6 new customers = (15670 * 80%) + 8250 = 20,786 customers Answer 7 Expected Trial rate = 20786 / 2500000 = 0.8314% Answer 7 Customer acquisition cost = $75 (Given in data) Answer 9 New customers = 7500 Total acquisition cost = 75 * 7500 = $562500 Total retention cost = total marketing cost - total acquisition cost = 563000 - 562,500 = $500 Total retained customers = 15670 - 7500 = 8170 customers Average retention cost per customer = 500 / 8170 = $0.061.. ... Answer 10 Beginning inventory = $2,600,000 Ending inventory = $2,750,000 Average Inventory = $2,675,000 Cost of goods sold can be calculated as below: Margin before marketing = Revenue - Cost of goods sold Hence, Cost of goods sold (COGS) = Revenue - Margin before marketing = 3919000 - 588000 = $3,331,000 Inventory turn-over ratio = COGS / Average inventory = 3331000/2675000 = 1.2452 turns .. Answer 11 Inventory days = 365/inventory turns = 365/1.2452 = 293.12 days .. . Answer 12 Price premium = Market share in value / Market share in volume = 15.37% / 16.39% = $ 0.938 . Answer 13 Cost of incremental sales = Variable cost per unit = 3331000 / 45568 = $73.01 . Answer 15