

Question: I need help with chapter 2 question 18 in Data Analytics: data analysis and decision making by s. christian albright. the example given on this
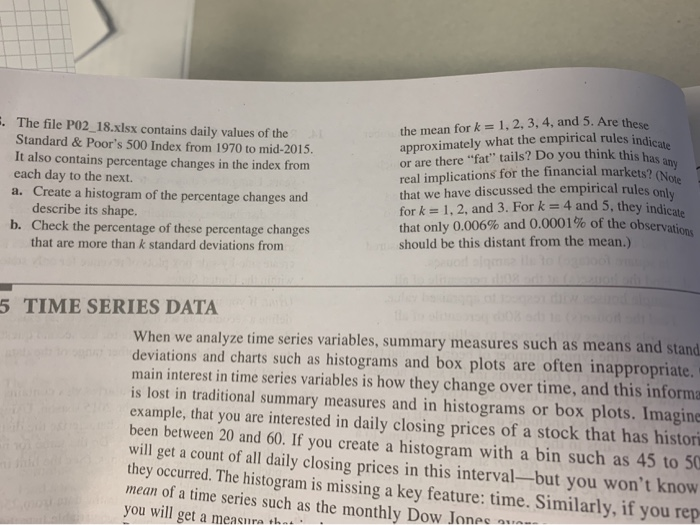
ules indicate k this has my arkets? (Note . The file P02_18.xlsx contains daily values of the Standard & Poor's 500 Index from 1970 to mid-2015. It also contains percentage changes in the index from each day to the next. a. Create a histogram of the percentage changes and describe its shape. b. Check the percentage of these percentage changes that are more than k standard deviations from the mean for k = 1, 2, 3, 4, and 5. Are the approximately what the empirical rules indi or are there "fat" tails? Do you think this ha real implications for the financial markets? that we have discussed the empirical rules on for k = 1, 2, and 3. For k= 4 and 5, they indi that only 0.006% and 0.0001% of the observa should be this distant from the mean.) observations 5 TIME SERIES DATA When we analyze time series variables, summary measures such as means and stand deviations and charts such as histograms and box plots are often inappropriate. main interest in time series variables is how they change over time, and this informa is lost in traditional summary measures and in histograms or box plots. Imagine example, that you are interested in daily closing prices of a stock that has histor been between 20 and 60. If you create a histogram with a bin such as 45 to SC will get a count of all daily closing prices in this intervalbut you won't know they occurred. The histogram is missing a key feature: time. Similarly, if you rep mean of a time series such as the monthly Dow Jones own you will get a measure that ules indicate k this has my arkets? (Note . The file P02_18.xlsx contains daily values of the Standard & Poor's 500 Index from 1970 to mid-2015. It also contains percentage changes in the index from each day to the next. a. Create a histogram of the percentage changes and describe its shape. b. Check the percentage of these percentage changes that are more than k standard deviations from the mean for k = 1, 2, 3, 4, and 5. Are the approximately what the empirical rules indi or are there "fat" tails? Do you think this ha real implications for the financial markets? that we have discussed the empirical rules on for k = 1, 2, and 3. For k= 4 and 5, they indi that only 0.006% and 0.0001% of the observa should be this distant from the mean.) observations 5 TIME SERIES DATA When we analyze time series variables, summary measures such as means and stand deviations and charts such as histograms and box plots are often inappropriate. main interest in time series variables is how they change over time, and this informa is lost in traditional summary measures and in histograms or box plots. Imagine example, that you are interested in daily closing prices of a stock that has histor been between 20 and 60. If you create a histogram with a bin such as 45 to SC will get a count of all daily closing prices in this intervalbut you won't know they occurred. The histogram is missing a key feature: time. Similarly, if you rep mean of a time series such as the monthly Dow Jones own you will get a measure that
Step by Step Solution
There are 3 Steps involved in it

Get step-by-step solutions from verified subject matter experts