

Question: I need help with creating the excel spreadsheet and the graph for question 1. Please attach on seprtate page so i can print it out.
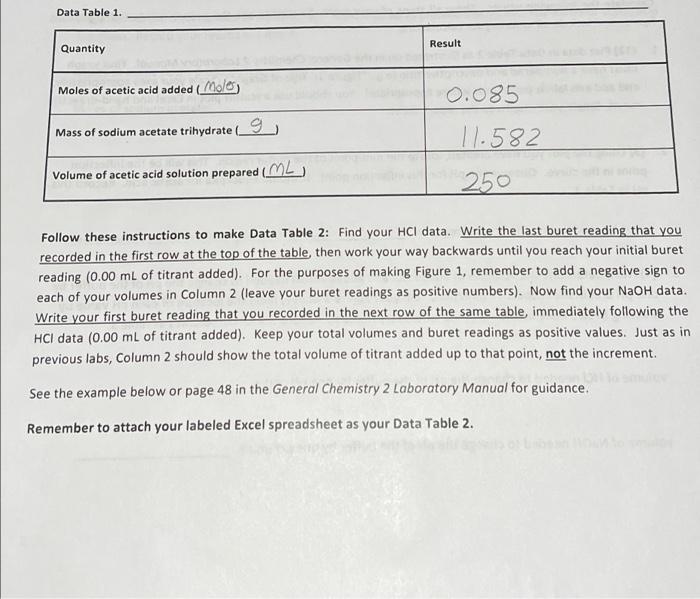
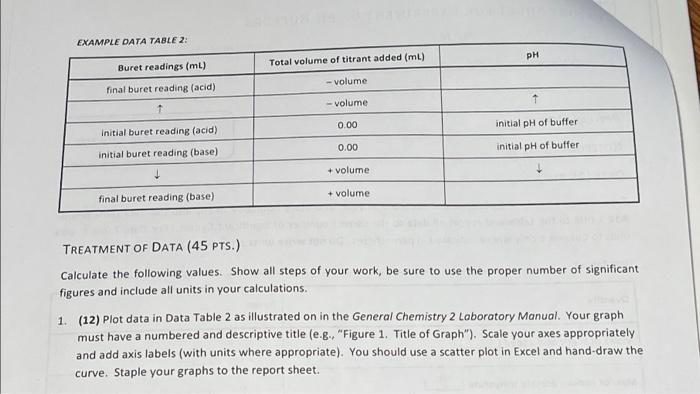
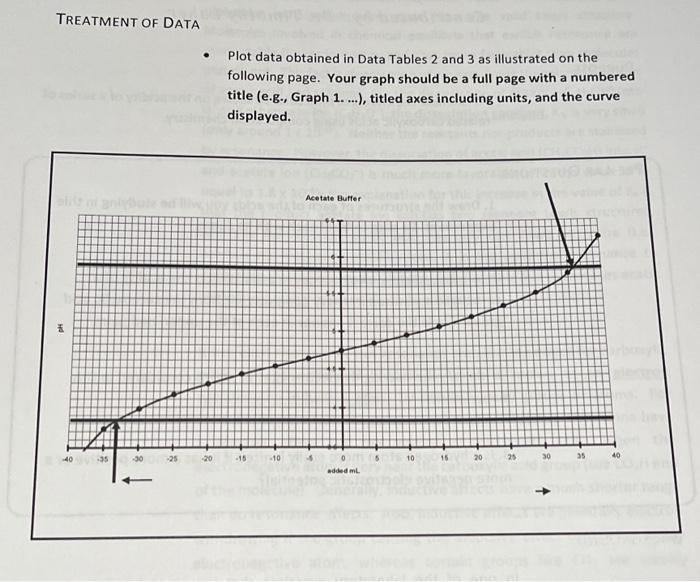
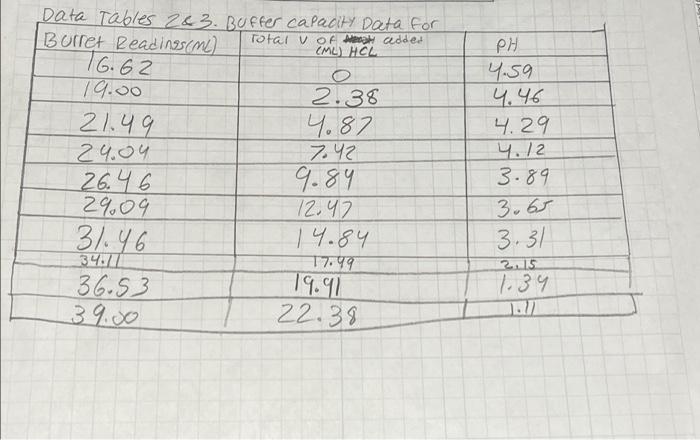
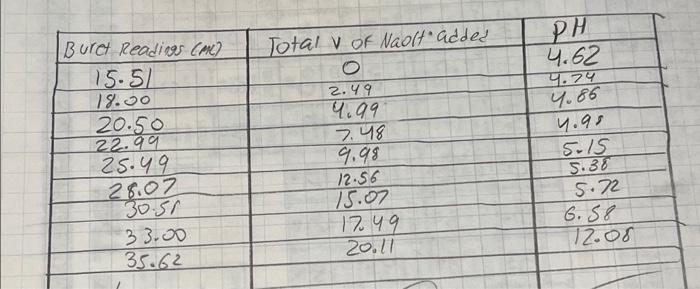
Data Table 1. Result Quantity Moles of acetic acid added Moles 0.085 11.582 Mass of sodium acetate trihydrate (9 volume of acetic acid solution prepared (ML 250 Follow these instructions to make Data Table 2: Find your HCl data. Write the last buret reading that yo recorded in the first row at the top of the table then work your way backwards until you reach your initial buret reading (0.00 mL of titrant added). For the purposes of making Figure 1, remember to add a negative sign to each of your volumes in Column 2 (leave your buret readings as positive numbers). Now find your NaOH data. Write your first buret reading that you recorded in the next row of the same table, immediately following the HCl data (0.00 mL of titrant added). Keep your total volumes and buret readings as positive values. Just as in previous labs, Column 2 should show the total volume of titrant added up to that point, not the increment. See the example below or page 48 in the General Chemistry 2 Laboratory Manual for guidance. Remember to attach your labeled Excel spreadsheet as your Data Table 2. EXAMPLE DATA TABLE 2: pH Buret readings (mL) Total volume of titrant added (mL) -volume final buret reading (acid) - volume 0.00 initial pH of buffer Initial buret reading (acid) 0.00 initial pH of buffer initial buret reading (base) + + volume + volume final buret reading (base) TREATMENT OF DATA (45 PTS.) Calculate the following values. Show all steps of your work, be sure to use the proper number of significant figures and include all units in your calculations 1. (12) Plot data in Data Table 2 as illustrated on in the General Chemistry 2 Laboratory Manual. Your graph must have a numbered and descriptive title (e.g., "Figure 1. Title of Graph"). Scale your axes appropriately and add axis labels (with units where appropriate). You should use a scatter plot in Excel and hand-draw the curve. Staple your graphs to the report sheet. TREATMENT OF DATA Plot data obtained in Data Tables 2 and 3 as illustrated on the following page. Your graph should be a full page with a numbered title (e.g., Graph 1. ...), titled axes including units, and the curve displayed. Acetate Buffer 1 -40 -25 20 -15 -10 5 10 15 2025 3035 40 added ml. Total VOA Neven added CML) HCL T6.62 Data Tables 263. Buffer capacity Data for Borret Readings(me) O 19.00 2.38 21.49 14.87 24.04 7.42 26.46 9.89 2%09 12.42 31.46 14.84 34/7 T7.99 36.53 19.92 39.00 22.38 PH 4.59 4.46 4.29 4.12 3.89 3.65 3.31 2.15 1.34 Total v of Naolt added Burct Readings Cme 15.51 19.00 20.50 22.99 25.49 28.02 30.51 33.00 35.62 2.49 9.99 7.48 9.98 12.56 15.07 17.49 20.11 PH 4.62 4.74 4.86 1.95 5-15 5.38 5.72 6.58 12.06
Step by Step Solution
There are 3 Steps involved in it

Get step-by-step solutions from verified subject matter experts