

Question: I need help with everything stated in the image and (c) Find the sample correlation coefficient r and the coefficient of determination. (Round your answers
I need help with everything stated in the image and (c) Find the sample correlation coefficient r and the coefficient of determination. (Round your answers to three decimal places.)r = ___r2 = ___What percentage of variation in y is explained by the least-squares model? (Round your answer to one decimal place.)___%(d) Test the claim that the population correlation coefficient ? is positive at the 5% level of significance. (Round your test statistic to three decimal places.t = ____Find or estimate the P-value of the tests statistic -P-value > 0.250-0.125 0. -Reject the null hypothesis. There is insufficient evidence that P>0-Fail to reject the null hypothesis. There is sufficient evidence that P>0-Fail to reject the null hypothesis. There is insufficient evidence that P>0(e) If someone had x = 10 job changes, what does the least-squares line predict for y, the annual salary? (Round your answer to two decimal places.)____ thousand dollars(f) Find Se. (Round your answer to three decimal places.)Se = ___(g) Find a 90% confidence interval for the annual salary of an individual with x = 10 job changes. (Round your answers to two decimal places.)lower limit___ thousand dollarsupper limit___ thousand dollars(h) Test the claim that the slope ? of the population least-squares line is positive at the 5% level of significance. (Round your test statistic to three decimal places)t = ___Find or estimate the P-value of the test statistic -P-value > 0.250-0.125 0. -Reject the null hypothesis. There is insufficient evidence that B>0-Fail to reject the null hypothesis. There is sufficient evidence that B> 0-Fail to reject the null hypothesis. There is insufficient evidence that B>0(i) Find a 90% confidence interval for ? and interpret its meaning. (Round your answers to three decimal places.)lower limit ___ upper limit ___Interpretation - for each additional job change, the annual salary increase by an amount that falls within the confidence interval- for each less job change, the annual salary increases by amount that's falls outside the confidence interval- for each less job change, the annual salary increases by and amount that falls with in the confidence interval-for each additional job change, the annual salary increases by and amount that falls outside the confidence interval
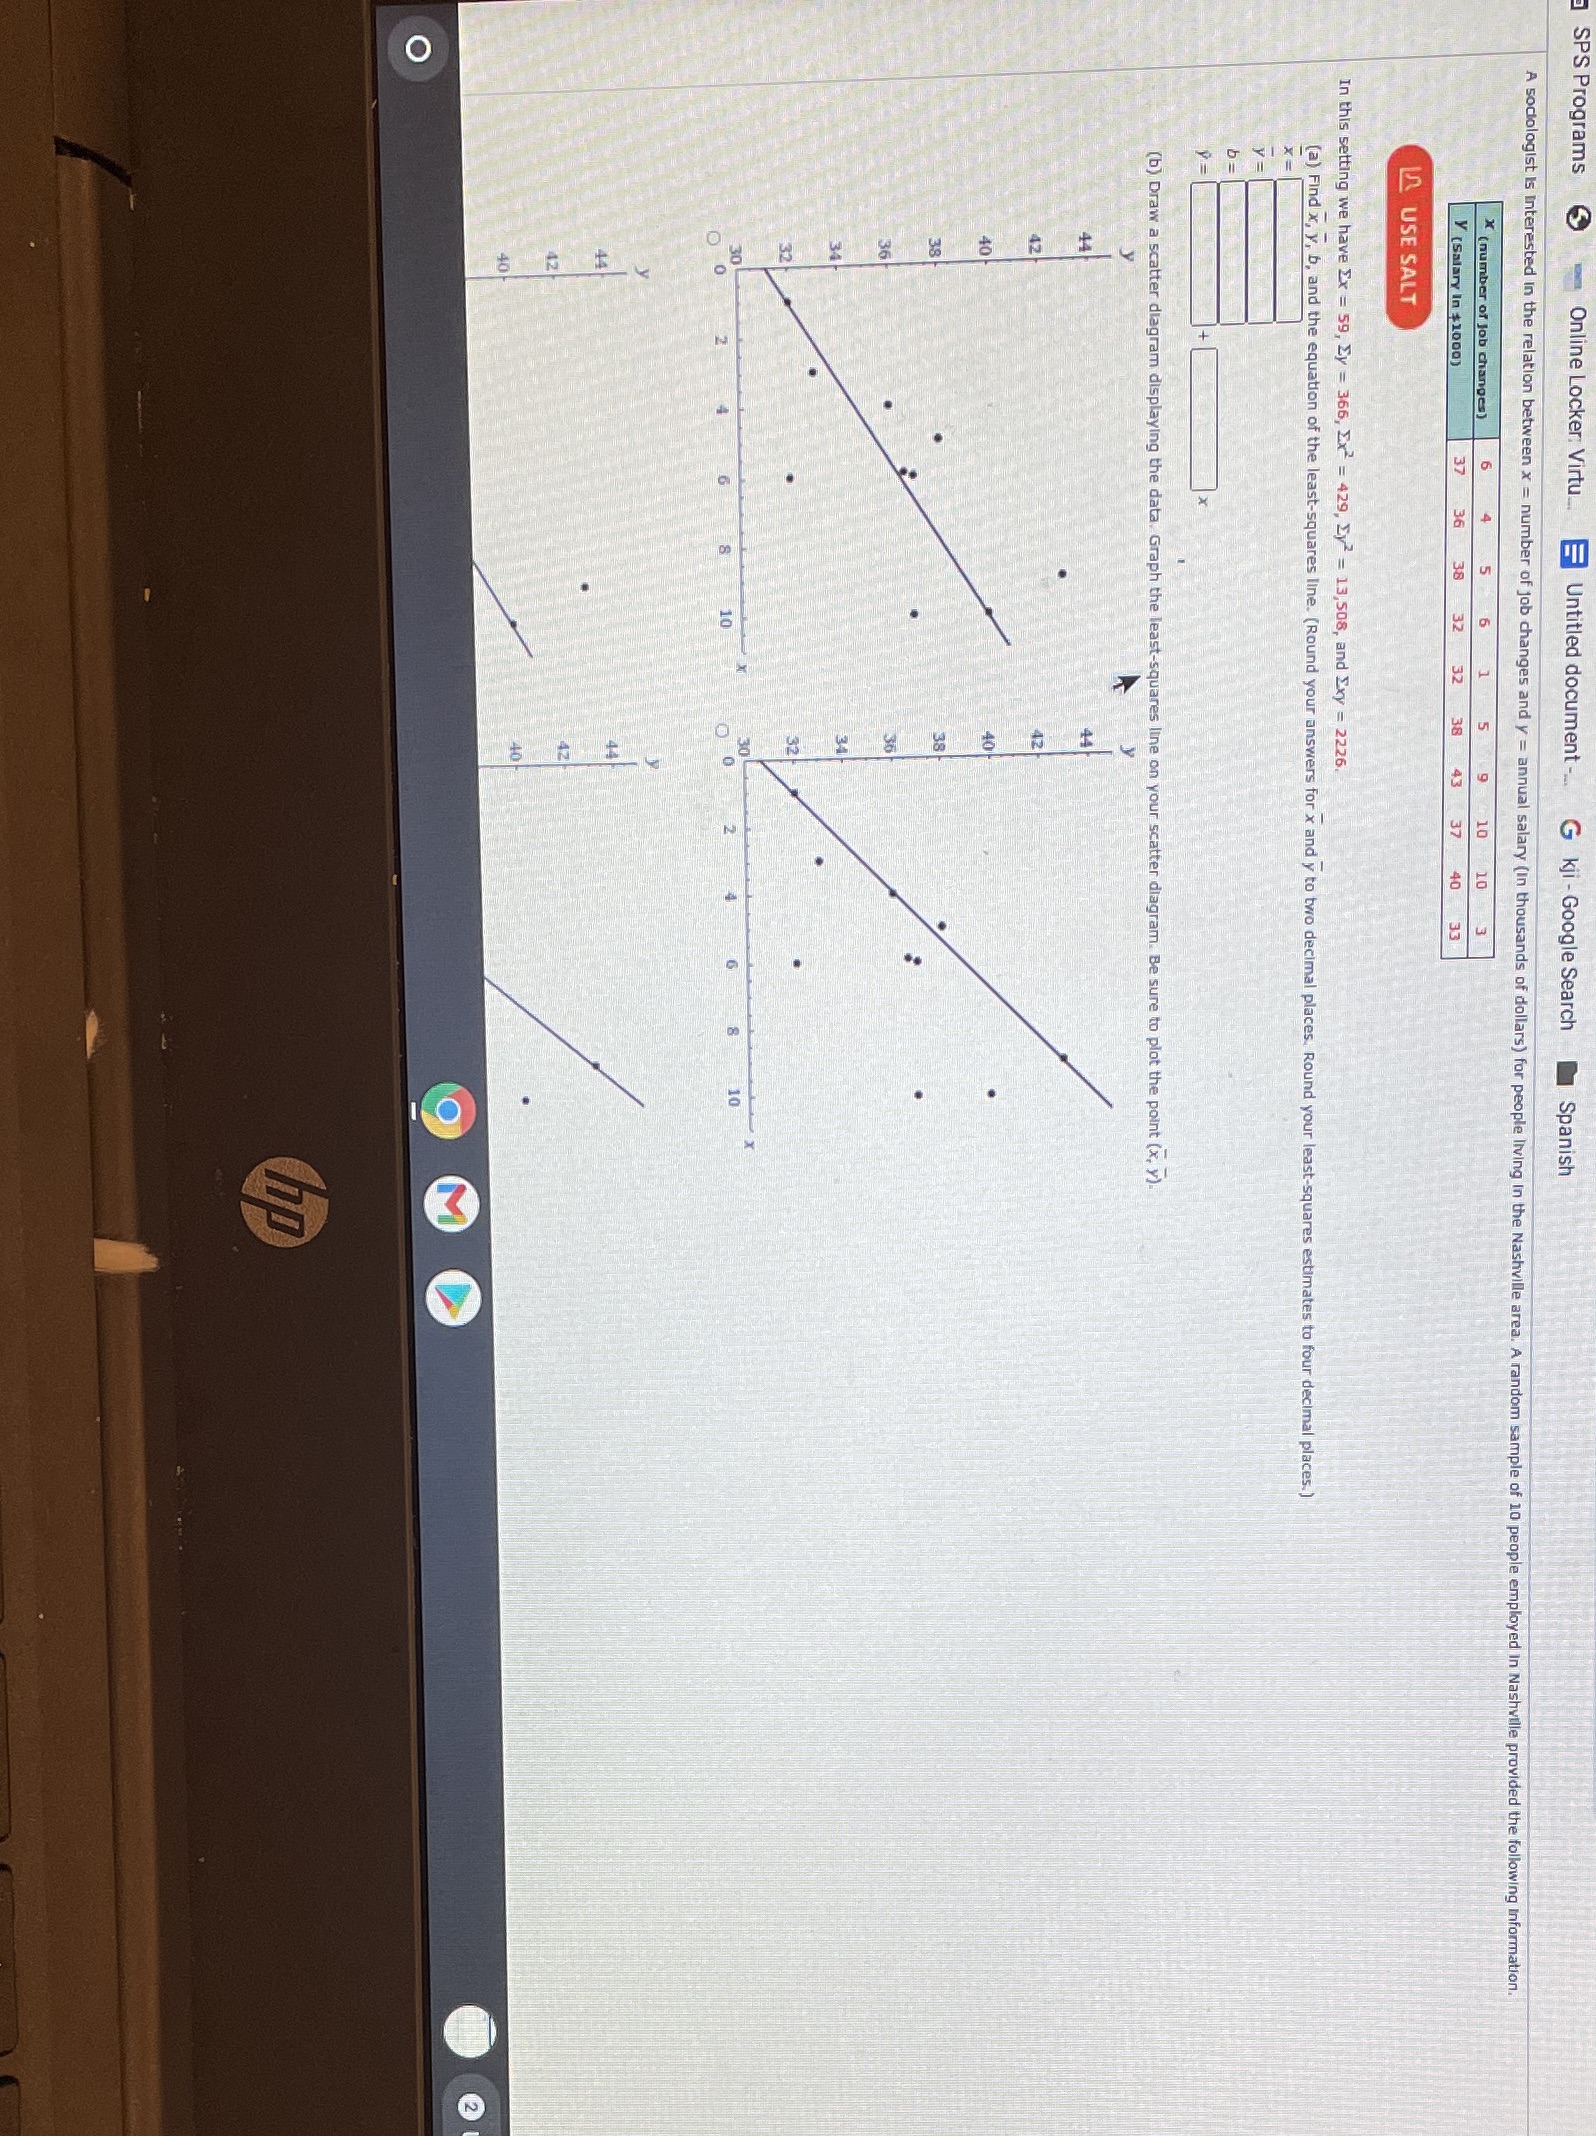
SPS Programs Online Locker: Virtu.. = Untitled document-.. G kji - Google Search Spanish A sociologist is Interested in the relation between x = number of job changes and y = annual salary (In thousands of dollars) for people living In the Nashville area. A random sample of 10 p ville provided the following Information. * ( number of job changes ) 6 9 10 10 3 Y [ Salary In #1000) 37 36 38 32 32 38 43 37 40 33 LA USE SALT In this setting we have Ex = 59, Ey = 366, Ex? = 429, Ly = 13,508, and Exy = 2226. ( a) Find x, y, b, and the equation of the least-squares line. (Round your answers for x and y to two decimal places. Round your least-squares estimates to four decimal places.) (b) Draw a scatter diagram displaying the data, Graph the least-squares line on your scatter diagram. Be sure to plot the point (x, y). 10 O O
Step by Step Solution
There are 3 Steps involved in it

Get step-by-step solutions from verified subject matter experts