

Question: I need help with the questions shown in the image and (c) Find the sample correlation coefficient r and the coefficient of determination (Round your
I need help with the questions shown in the image and (c) Find the sample correlation coefficient r and the coefficient of determination (Round your answers to three decimal places)r = __r = ___What percentage of variation in y is explained by the least - squares model? (Round your answer to one decimal place) ___%(d) Test the claim that the population correlation coefficient P is positive at the 1% level of significance (Round your test statistic to three decimal places) t = __Find or estimate the P-value of the test statistic -P-value > 0.250 -0.125 0-Reject the null hypothesis. There is insufficient evidence that P>0-Fail to reject the null hypothesis. There is sufficient evidence that P>0-Fail to reject the null hypothesis. There is insufficient evidence that P>0(e) If a female baby weighs 21 pounds at 1 year, what do you predict she will weigh at 30 years of age? ( Round your answer to two decimal places) ____ Ib (f) Find Se (Round your answer to two decimal places) Se___(g) Find a 95% confidence interval for weight at age 30 of a female who weighed 21 pounds at 1 year of age. (Round your answers to two decimal places) lower limit ___ Ib upper limit ___ Ib(h) test the claim that's the slope B of the population least-squares line is positive at the 1% level of significance (Round your test statistic to three decimal places) t = ___Find or estimate the P-value of the test statistic. -P-value > 0.250 -0.125 0-Reject the null hypothesis. There is insufficient evidence that B>0-Fail to reject the null hypothesis. There is sufficient evidence that B>0-Fail to reject the null hypothesis. There is insufficient evidence that B>0(I) Find an 80% confidence interval for B and interpret its meaning. (Round your answers to three decimal places.) lower limit ___upper limit ___Interpretation - for each pound more a female infant weighs at one year, the adult weight increases by an amount that falls within the confidence interval- for each pound more a female infant weighs at one year, the adult weight increases by an amount that falls outside the confidence interval- for each pound less a female infant weighs at one year, the adult weight increases my amount that falls outside the confidence interval- for each pound less a female infant weighs at one year, the adult weight increases by amount that falls within the confidence interval
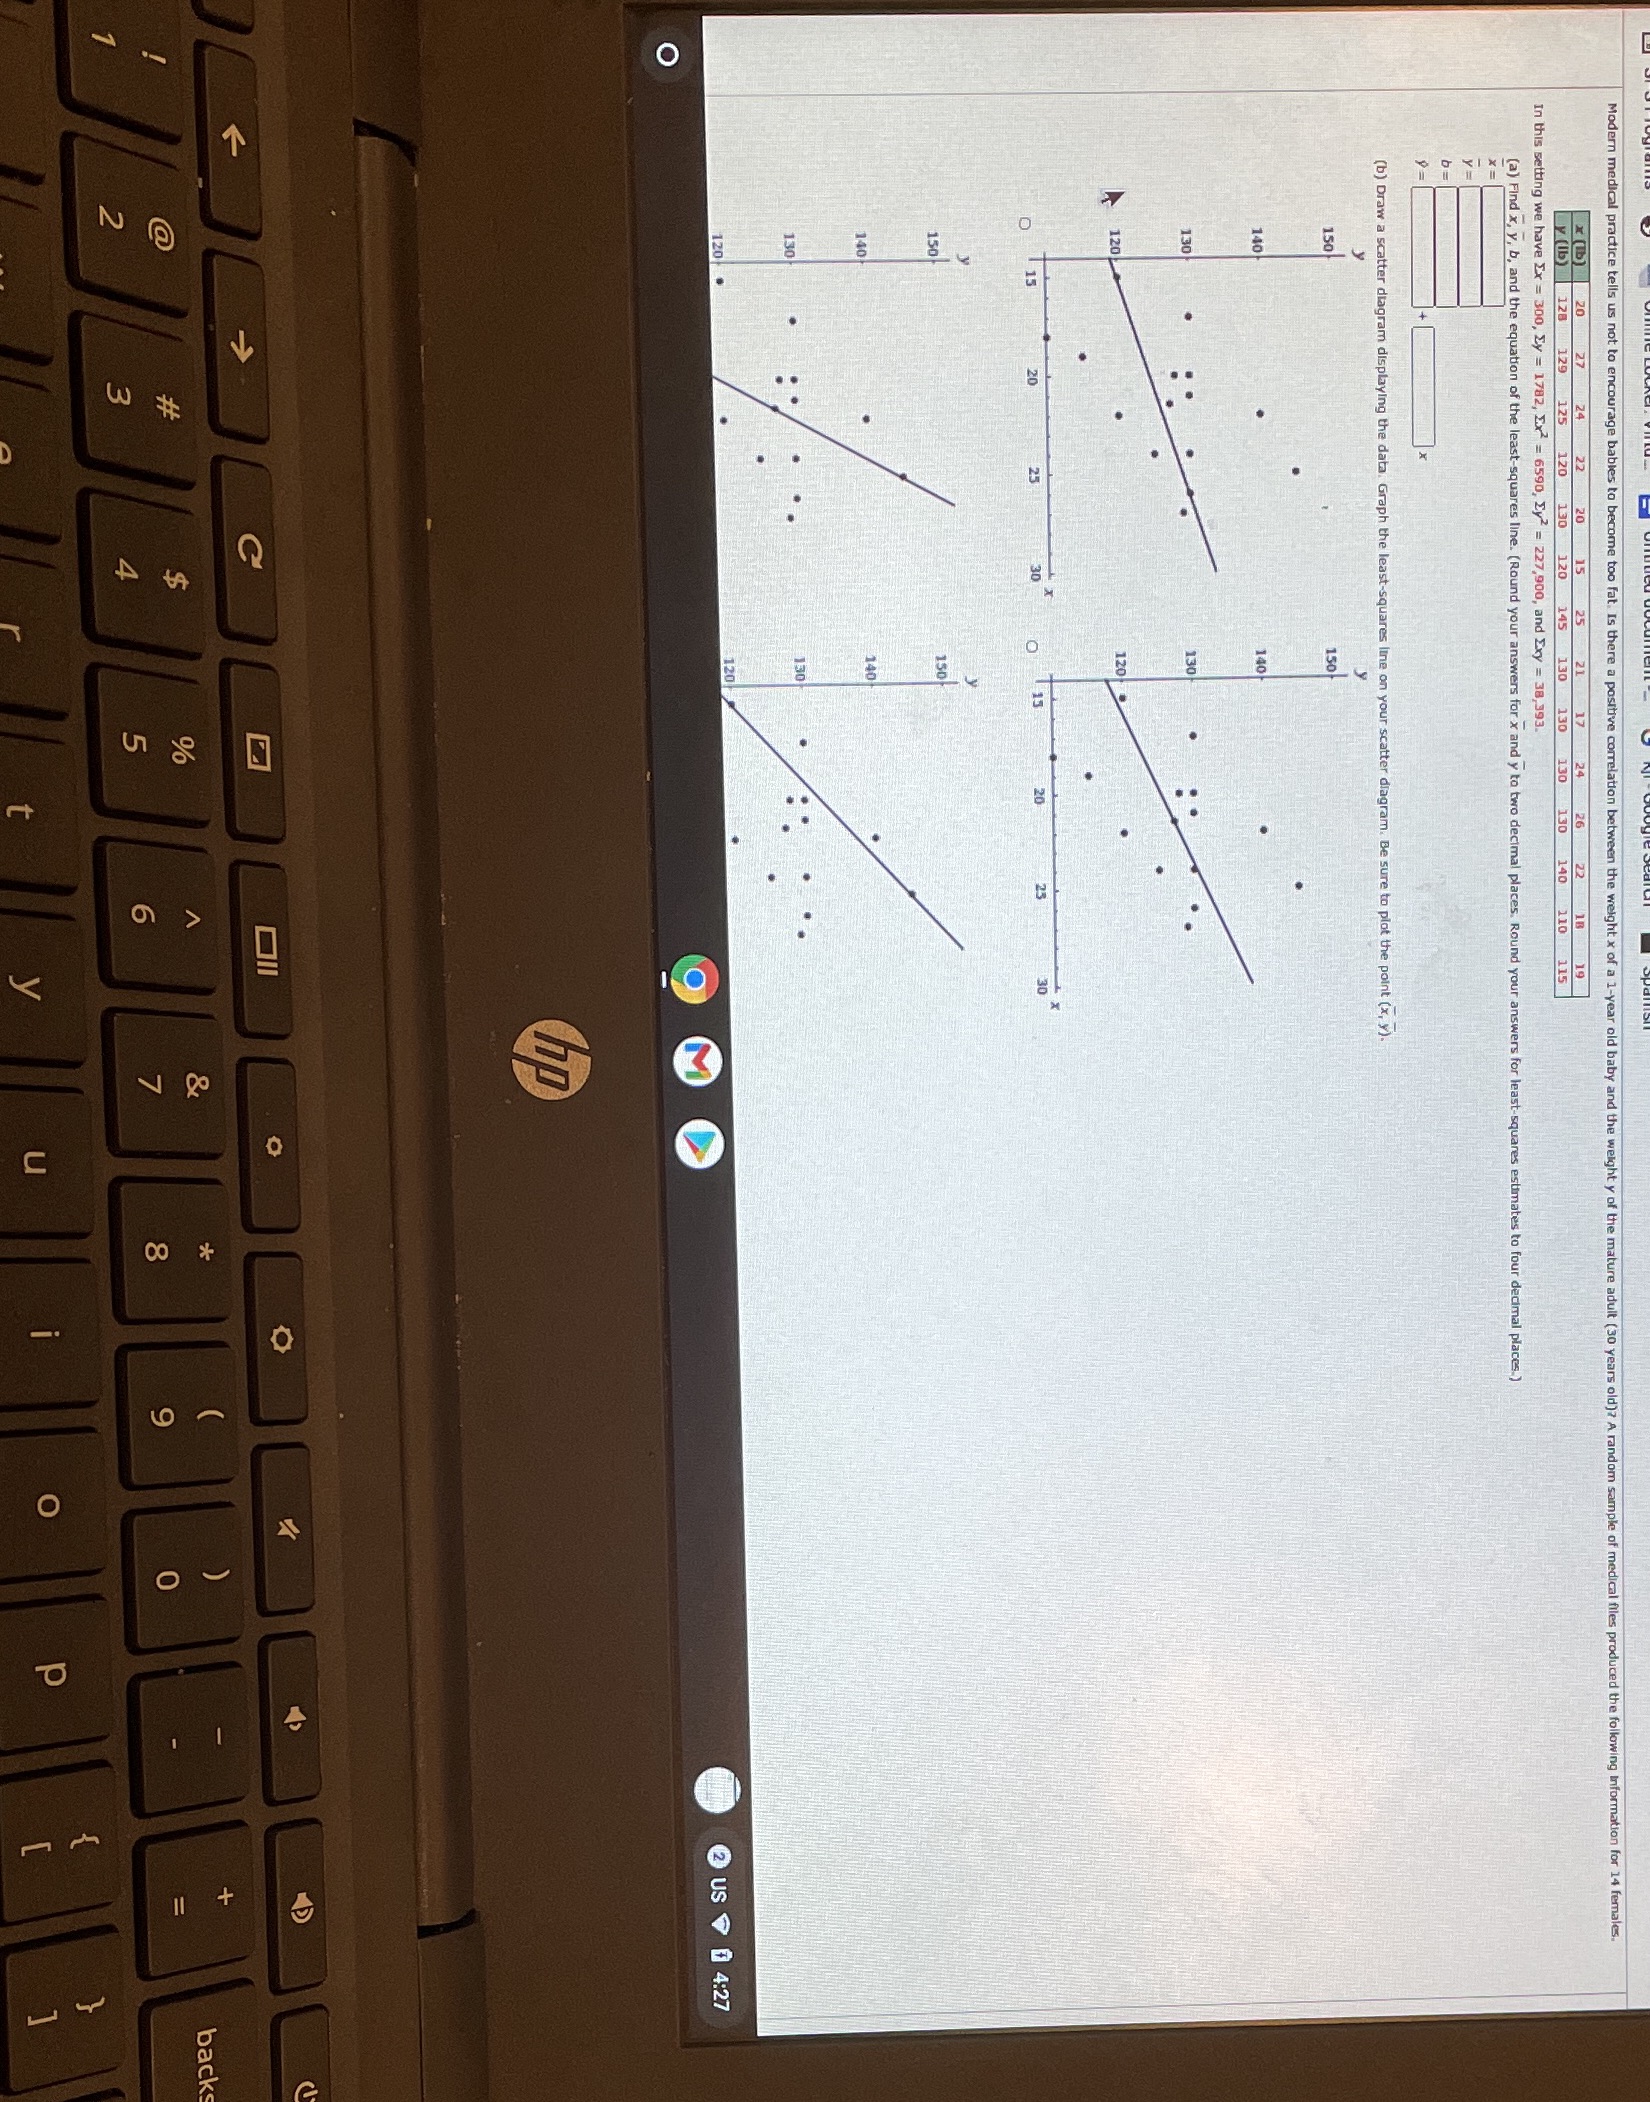
Modern medical practice tells us not to encourage babies to become too fat. Is there a positive correlation between the weight x of a 1-year old baby and the weight y of the mature adult (30 years old)? A x (1b) 20 27 24 22 20 15 (1b) 128 129 125 120 130 120 145 17 24 26 22 130 140 120 19 In this setting we have Ex = 300, Zy = 1782, Ex = 6590, Ey? = 227,900, and Exy = 38,393. (a ) Find x, y, b, and the equation of the least-squa ares line. (Round your answers for x and y to two decimal places. Round your answers for least-squares estimates to four decimal places.) (b) Draw a scatter diagram displaying the data. Graph the least-squares line on your scatter diagram. Be sure sure to plat the point (x, y). 140 15 30 120 2 US 1 4:27 O back O m N O C
Step by Step Solution
There are 3 Steps involved in it

Get step-by-step solutions from verified subject matter experts