Question: I need help with figuring our the data that goes into yellow highlighted areas on this supply chain project, and answering the problems under section
I need help with figuring our the data that goes into yellow highlighted areas on this supply chain project, and answering the problems under section 3.
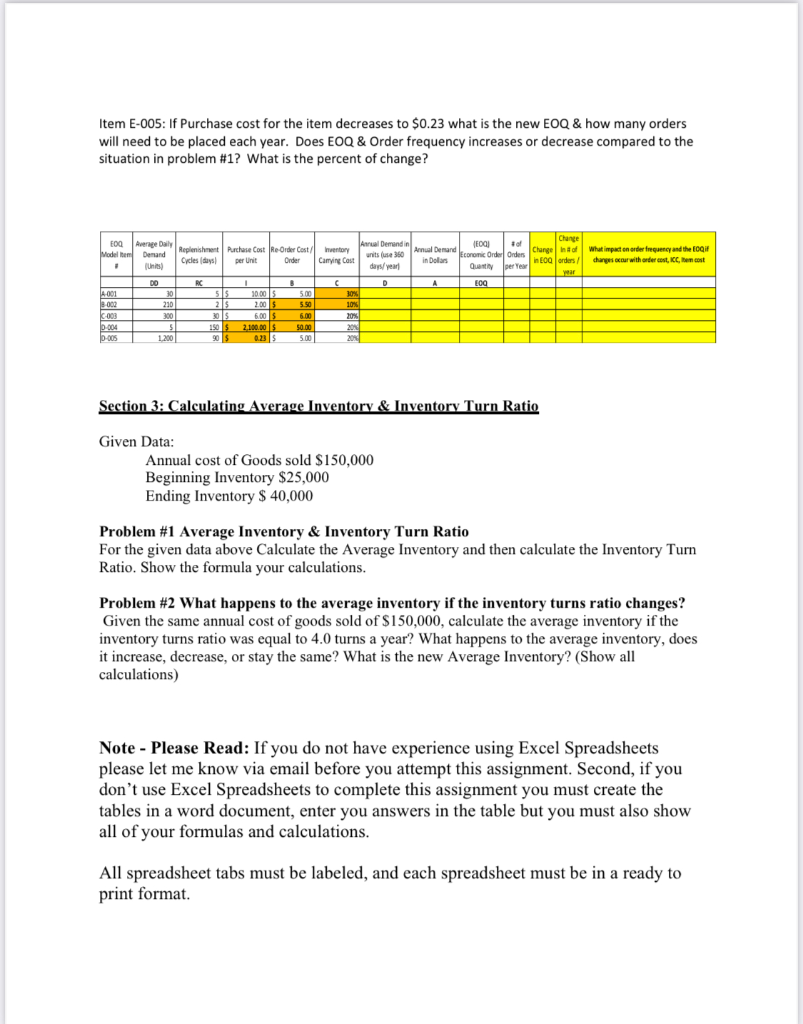
Item E-005: If Purchase cost for the item decreases to $0.23 what is the new EOQ & how many orders will need to be placed each year. Does EOQ & Order frequency increases or decrease compared to the situation in problem #1? What is the percent of change? A Demanded coronic Order Onde Clungen EDQ Average Dail EOGI Change Model Demand Replenishment Purchase Cost Re-Order Cost/ Inventory of Change in what impact on order frequency and the follit Cycles per Unit units Order Carrying Cost in Dolars days/year in orders/ changes occur with order cost, Kem cost Year 1 C D A Og 14001 30 55 3000 500 30% 2000 210 215 2.00 5.50 % 10% 6-003 300 303 6.00 $ 6.00 20% 0.004 5 150 2.100.00 50.00 2011 D-005 1.200 90$ 0.23 5.00 Garthyerve intoarders 2014 Section 3: Calculating Average Inventory & Inventory Turn Ratio Given Data: Annual cost of Goods sold $150,000 Beginning Inventory $25,000 Ending Inventory $ 40,000 Problem #1 Average Inventory & Inventory Turn Ratio For the given data above Calculate the Average Inventory and then calculate the Inventory Turn Ratio. Show the formula your calculations. Problem #2 What happens to the average inventory if the inventory turns ratio changes? Given the same annual cost of goods sold of $150,000, calculate the average inventory if the inventory turns ratio was equal to 4.0 turns a year? What happens to the average inventory, does it increase, decrease, or stay the same? What is the new Average Inventory? (Show all calculations) Note - Please Read: If you do not have experience using Excel Spreadsheets please let me know via email before you attempt this assignment. Second, if you don't use Excel Spreadsheets to complete this assignment you must create the tables in a word document, enter you answers in the table but you must also show all of your formulas and calculations. All spreadsheet tabs must be labeled, and each spreadsheet must be in a ready to print format. Item E-005: If Purchase cost for the item decreases to $0.23 what is the new EOQ & how many orders will need to be placed each year. Does EOQ & Order frequency increases or decrease compared to the situation in problem #1? What is the percent of change? A Demanded coronic Order Onde Clungen EDQ Average Dail EOGI Change Model Demand Replenishment Purchase Cost Re-Order Cost/ Inventory of Change in what impact on order frequency and the follit Cycles per Unit units Order Carrying Cost in Dolars days/year in orders/ changes occur with order cost, Kem cost Year 1 C D A Og 14001 30 55 3000 500 30% 2000 210 215 2.00 5.50 % 10% 6-003 300 303 6.00 $ 6.00 20% 0.004 5 150 2.100.00 50.00 2011 D-005 1.200 90$ 0.23 5.00 Garthyerve intoarders 2014 Section 3: Calculating Average Inventory & Inventory Turn Ratio Given Data: Annual cost of Goods sold $150,000 Beginning Inventory $25,000 Ending Inventory $ 40,000 Problem #1 Average Inventory & Inventory Turn Ratio For the given data above Calculate the Average Inventory and then calculate the Inventory Turn Ratio. Show the formula your calculations. Problem #2 What happens to the average inventory if the inventory turns ratio changes? Given the same annual cost of goods sold of $150,000, calculate the average inventory if the inventory turns ratio was equal to 4.0 turns a year? What happens to the average inventory, does it increase, decrease, or stay the same? What is the new Average Inventory? (Show all calculations) Note - Please Read: If you do not have experience using Excel Spreadsheets please let me know via email before you attempt this assignment. Second, if you don't use Excel Spreadsheets to complete this assignment you must create the tables in a word document, enter you answers in the table but you must also show all of your formulas and calculations. All spreadsheet tabs must be labeled, and each spreadsheet must be in a ready to print format


