

Question: I need help with finding these solvency ratios for Lowes. If someone could help me with how to figure out year 2021 for the ones
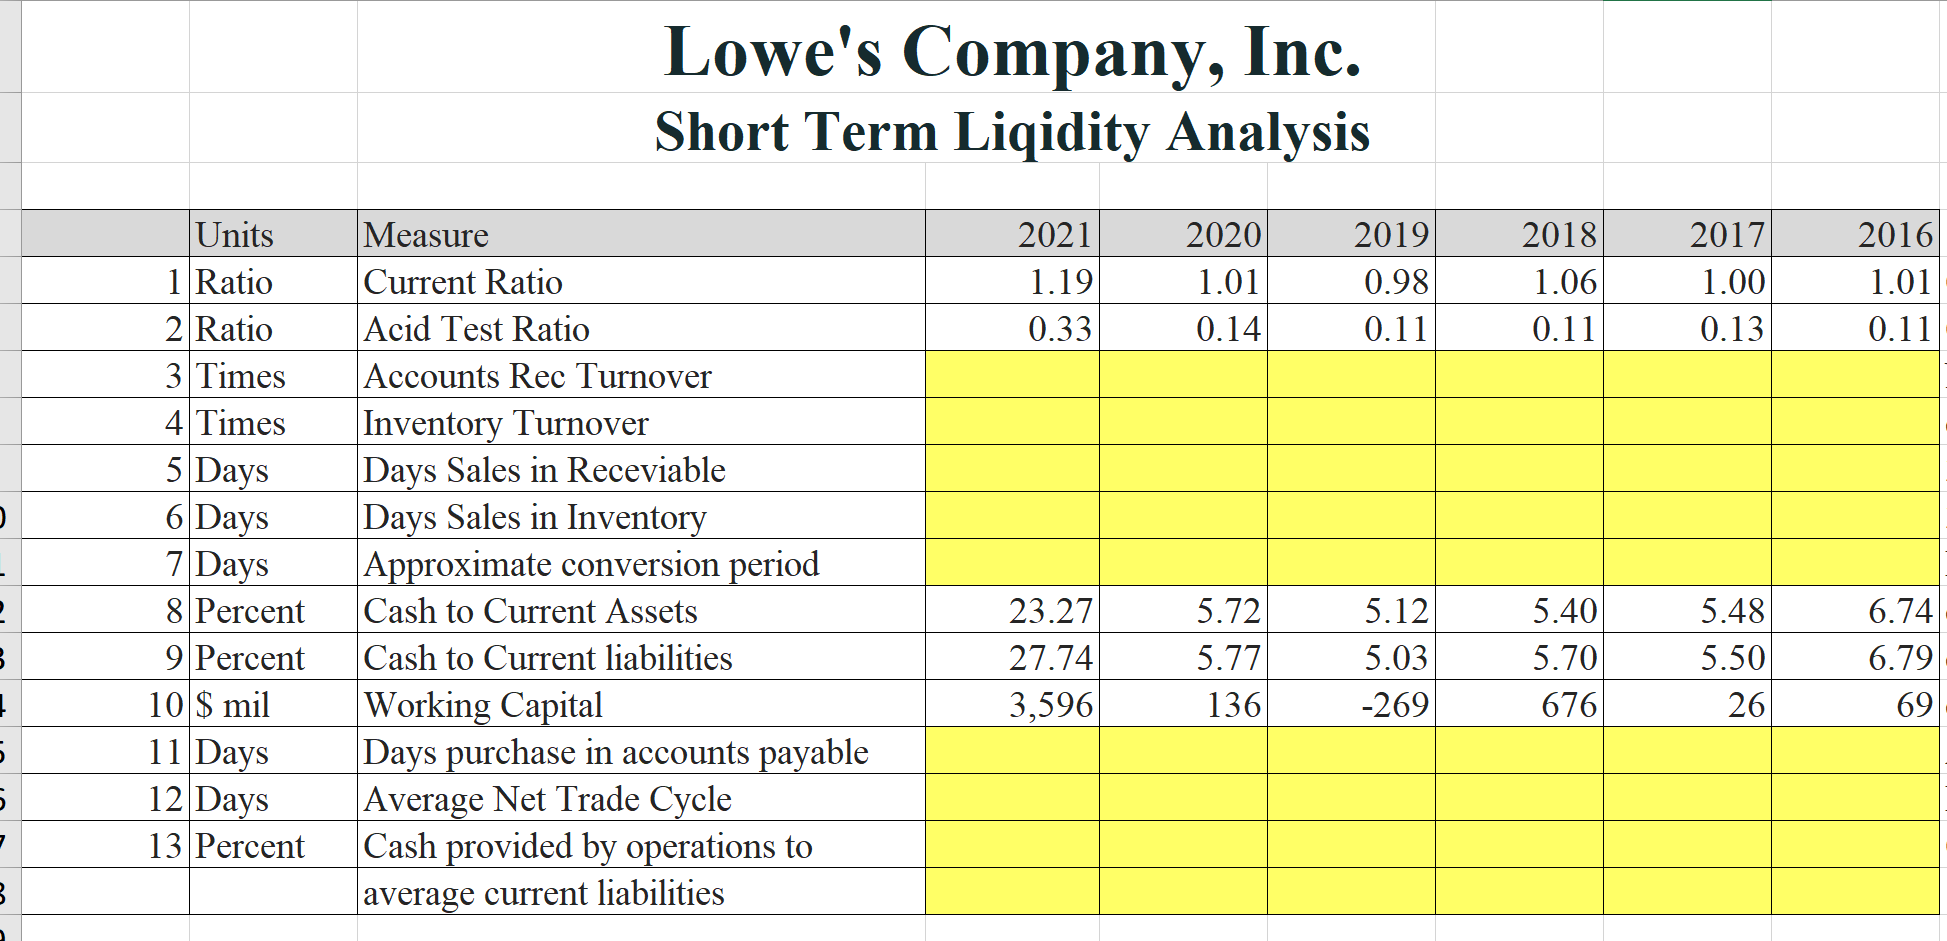
I need help with finding these solvency ratios for Lowes. If someone could help me with how to figure out year 2021 for the ones highlighted in yellow, I can do the rest on my own. Thank you! (Im confused on where to get the numbers from! The Lowes balance sheet is all in %???) Please let me know where the numbers are coming from!! I actually want to learn.
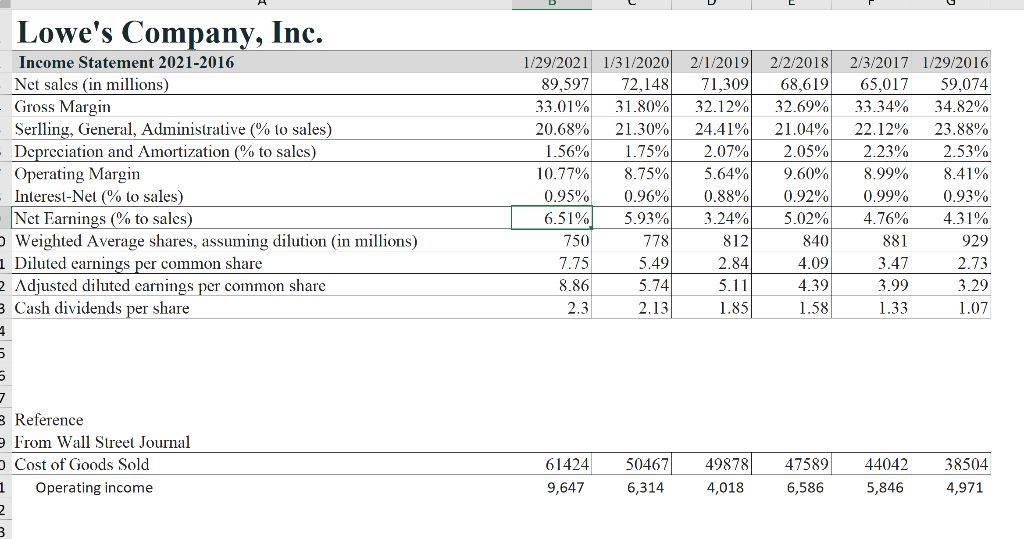
Lowes Income Statement 2021-2016
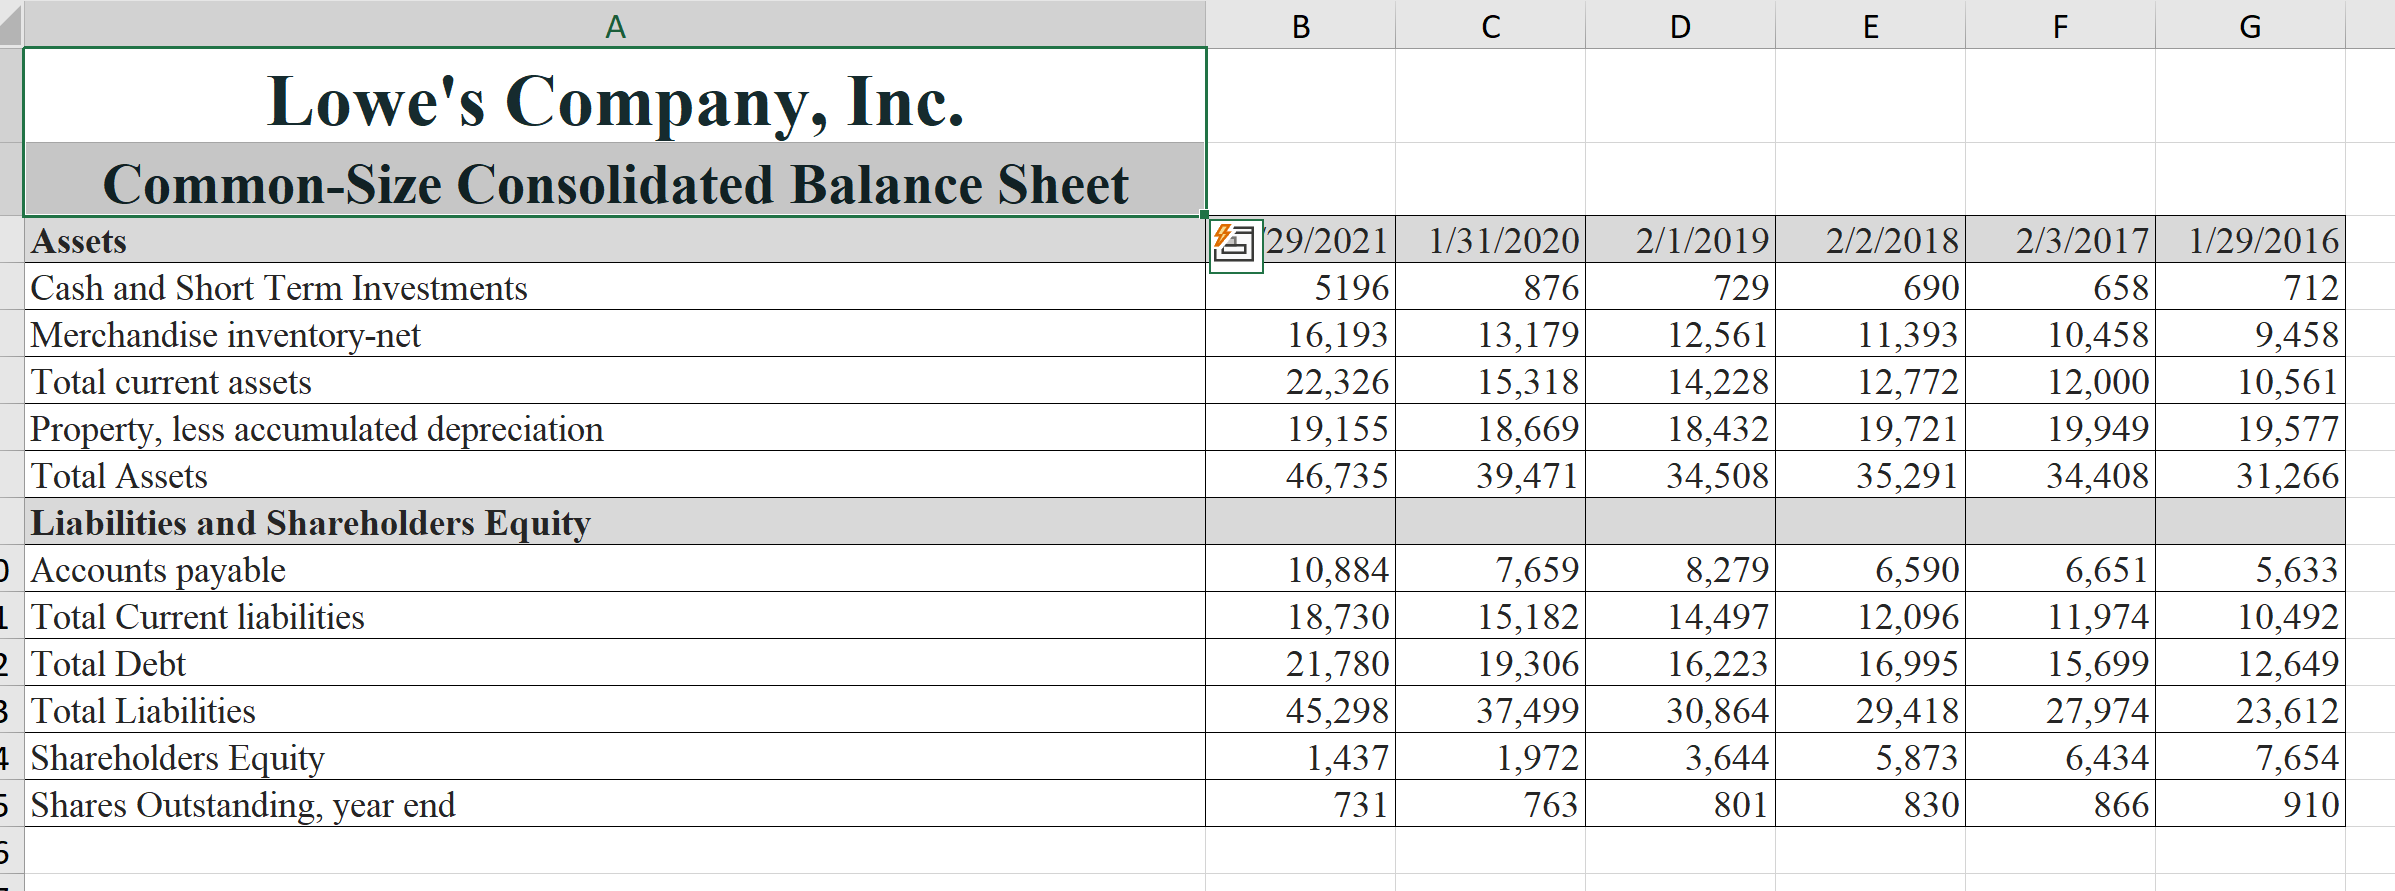
Lowes Balance Sheet 2021-2016
Lowes Statement of Cash Flows
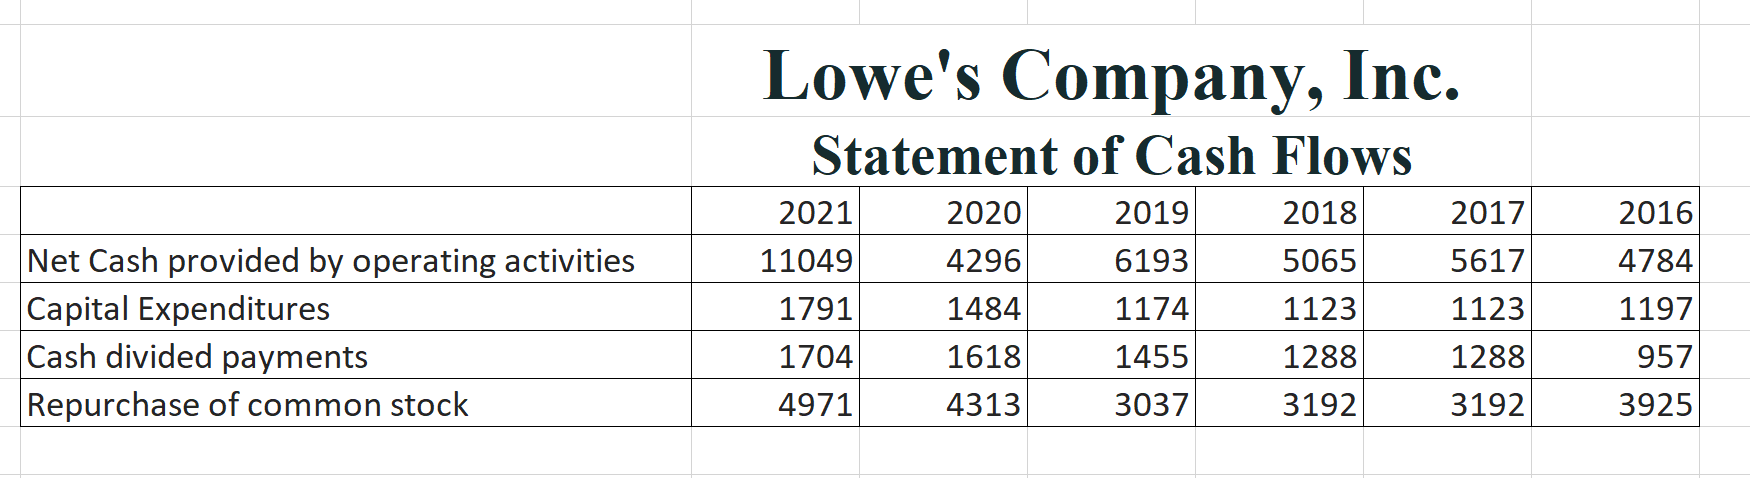
Lowe's Company, Inc. Short Term Liqidity Analysis 2021 1.19 0.33 2020 1.01 0.14 2019 0.98 0.11 2018 1.06 0.11 2017 1.00 0.13 2016 1.01 0.11 Units 1 Ratio 2 Ratio 3 Times 4 Times 5 Days 6 Days 7 Days 8 Percent 9 Percent 10 $ mil 11 Days 12 Days 13 Percent Measure Current Ratio Acid Test Ratio Accounts Rec Turnover Inventory Turnover Days Sales in Receviable Days Sales in Inventory Approximate conversion period Cash to Current Assets Cash to Current liabilities Working Capital Days purchase in accounts payable Average Net Trade Cycle Cash provided by operations to average current liabilities 23.27 27.74 3,596 5.72 5.77 136 5.12 5.03 -269 5.40 5.70 676 5.48 5.50 26 6.74 6.79 69 5 3 Lowe's Company, Inc. Income Statement 2021-2016 Net sales (in millions) Gross Margin Serlling, General, Administrative (% to sales) Depreciation and Amortization to sales) Operating Margin Interest-Net (% to sales) Net Earnings (% to sales) Weighted Average shares, assuming dilution (in millions) 1 Diluted earnings per common share 2 Adjusted diluted earnings per common share 3 Cash dividends per share 1 1/29/2021 1/31/2020 2/1/2019 2/2/2018 89,597 72,148 71,309 68,619 33.01% 31.80% 32.12% 32.69% 20.68% 21.30% 24.41% 21.04% 1.56% 1.75% 2.07% 2.05% 10.77% 8.75% 5.64% 9.60% 0.95% 0.96% 0.88% 0.92% 6.51% 5.93% 3.24% 5.02% 750 778 812 7.75 5.49 2.84 4.09 8.86 5.74 5.11 4.39 2.3 2.13 1.85 1.58 2/3/2017 1/29/2016 65,017 59,074 33.34% 34.82% 22.12% 23.88% 2.23% 2.53% 8.99% 8.41% 0.99% 0.93% 4.76% 4.31% 881 929 3.47 2.73 3.99 3.29 1.33 1.07 840 5 7 8 Reference From Wall Street Journal Cost of Goods Sold 1 Operating income 2 61424 9,647 50467 6,314 49878 4,018 47589 6,586 44042 5,846 38504 4,971 A B D E F G Lowe's Company, Inc. Common-Size Consolidated Balance Sheet Assets Cash and Short Term Investments Merchandise inventory-net Total current assets Property, less accumulated depreciation Total Assets Liabilities and Shareholders Equity Accounts payable 1 Total Current liabilities 2 Total Debt 3 Total Liabilities 1 Shareholders Equity 5 Shares Outstanding, year end 5 29/2021 5196 16,193 22,326 19,155 46,735 1/31/2020 876 13,179 15,318 18,669 39,471 2/1/2019 729 12,561 14,228 18,432 34,508 2/2/2018 690 11,393 12,772 19,721 35,291 2/3/2017 658 10,458 12,000 19,949 34,408 1/29/2016 712 9,458 10,561 19,577 31,266 10,884 18,730 21,780 45,298 1,437 731 7,659 15,182 19,306 37,499 1,972 763 8,279 14,497 16,223 30,864 3,644 801 6,590 12,096 16,995 29,418 5,873 830 6,651 11,974 15,699 27,974 6,434 866 5,633 10,492 12,649 23,612 7,654 910 Lowe's Company, Inc. Statement of Cash Flows 2021 2020 2019 2018 2016 2017 5617 4296 6193 5065 4784 11049 1791 1484 1174 1123 1123 Net Cash provided by operating activities Capital Expenditures Cash divided payments Repurchase of common stock 1197 957 1288 1704 4971 1618 4313 1455 3037 1288 3192 3192 3925
Step by Step Solution
There are 3 Steps involved in it

Get step-by-step solutions from verified subject matter experts