

Question: I'm needing some help in finding the information needed to complete my paper. My company is Apple and I'm having a hard time so any
I'm needing some help in finding the information needed to complete my paper. My company is Apple and I'm having a hard time so any help would be appreciated.
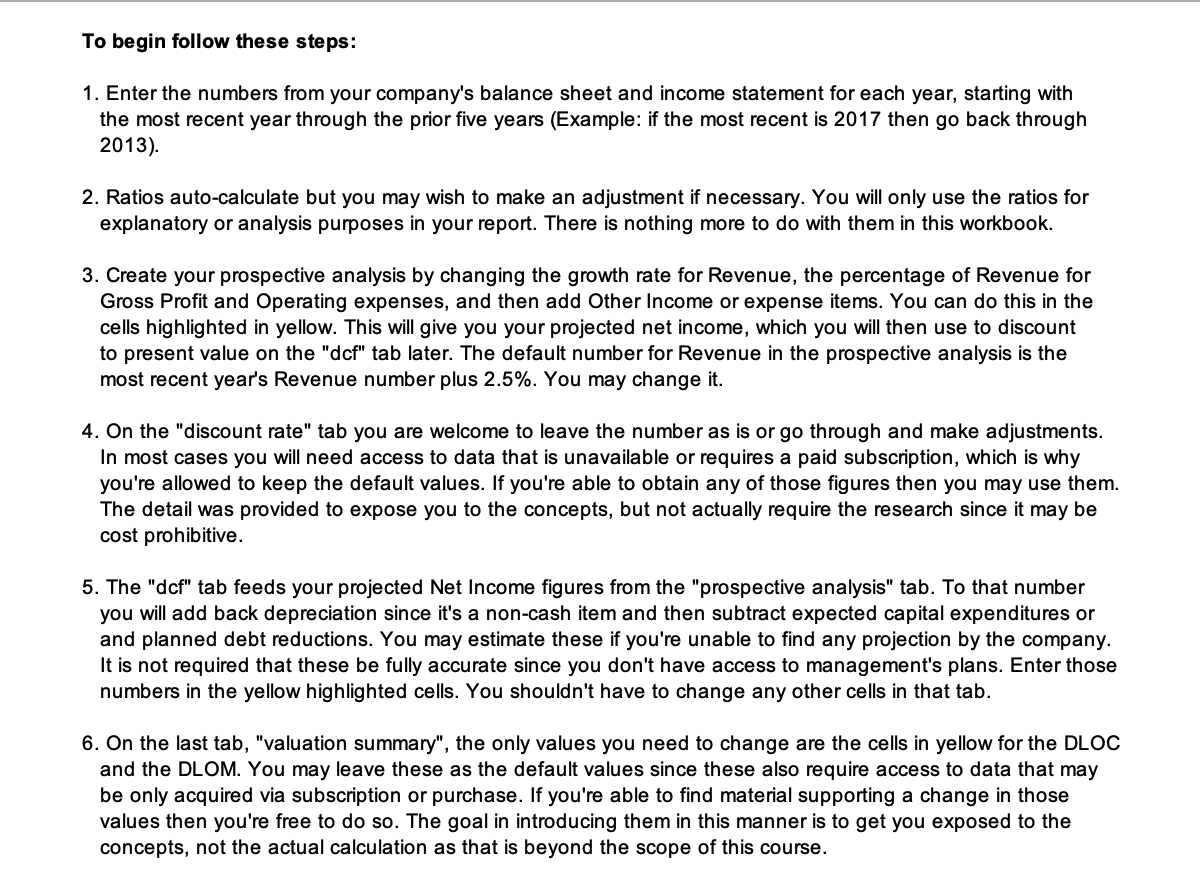
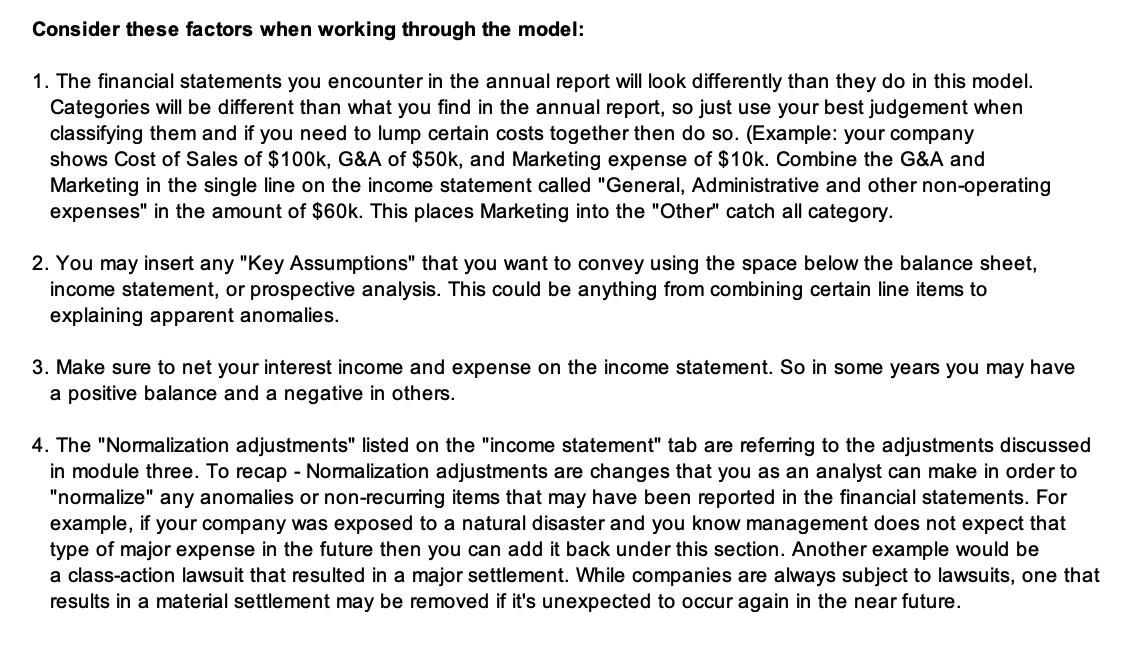
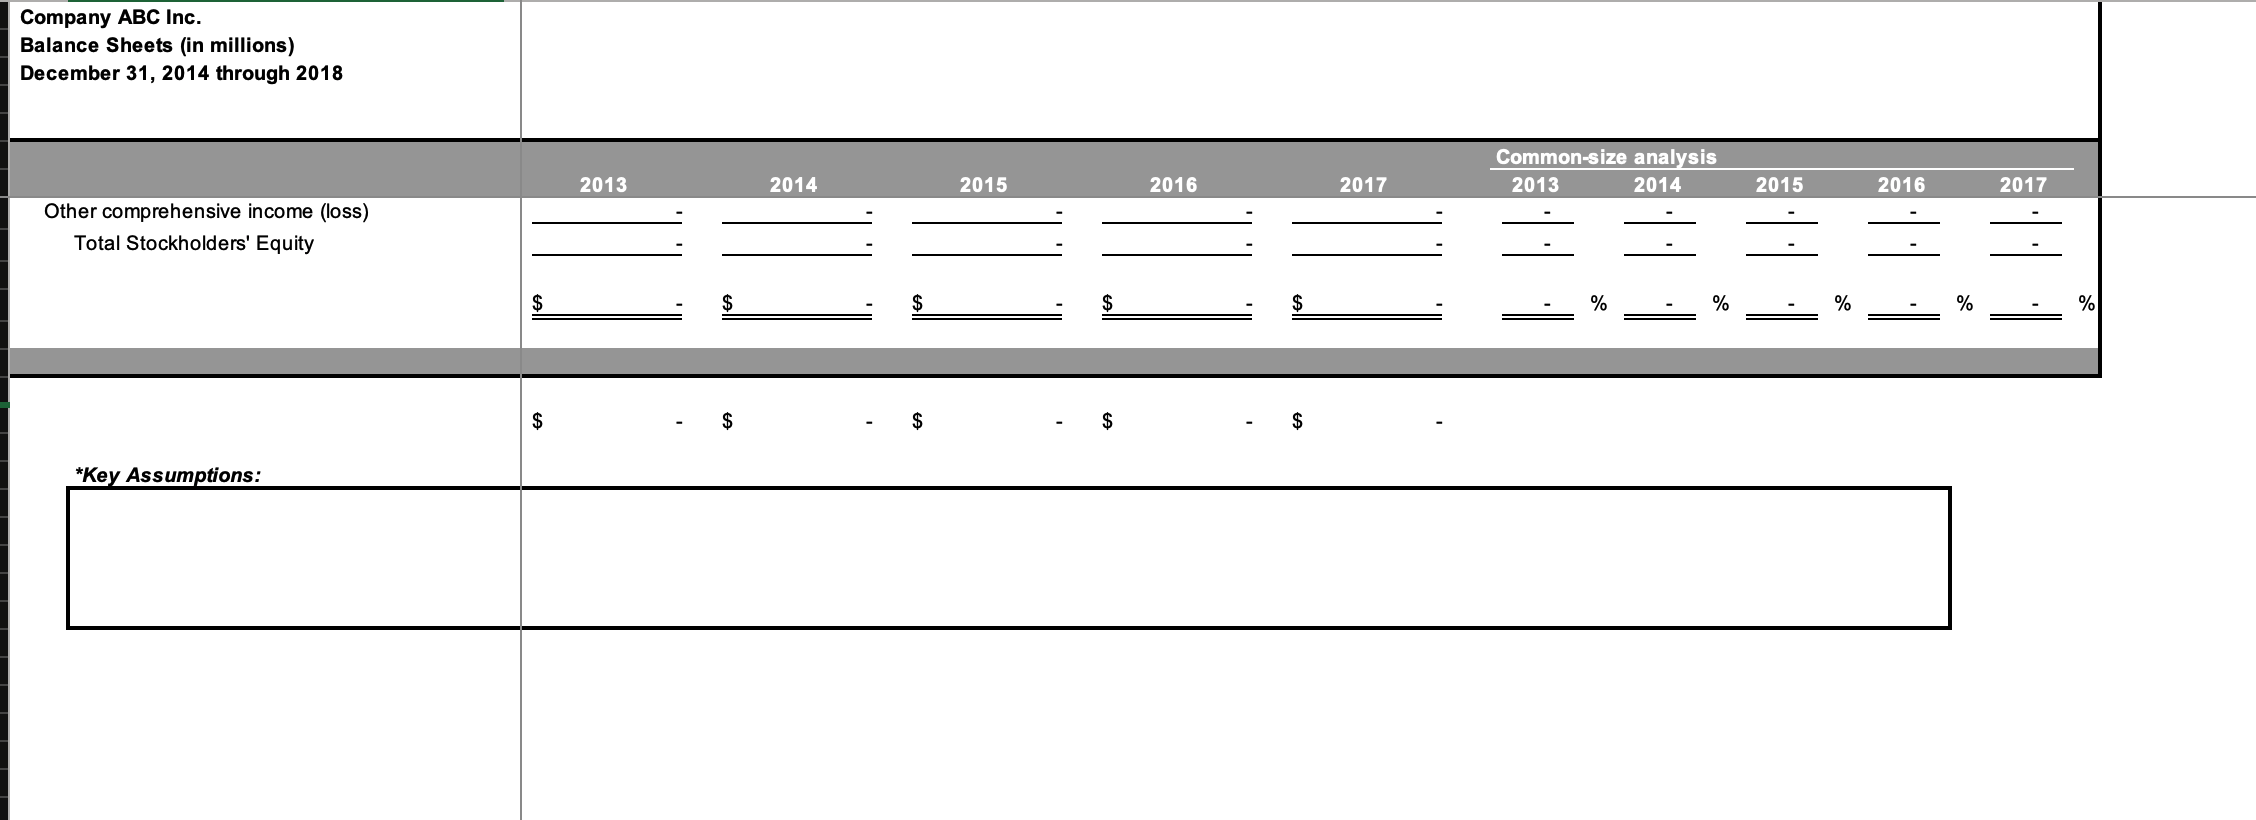
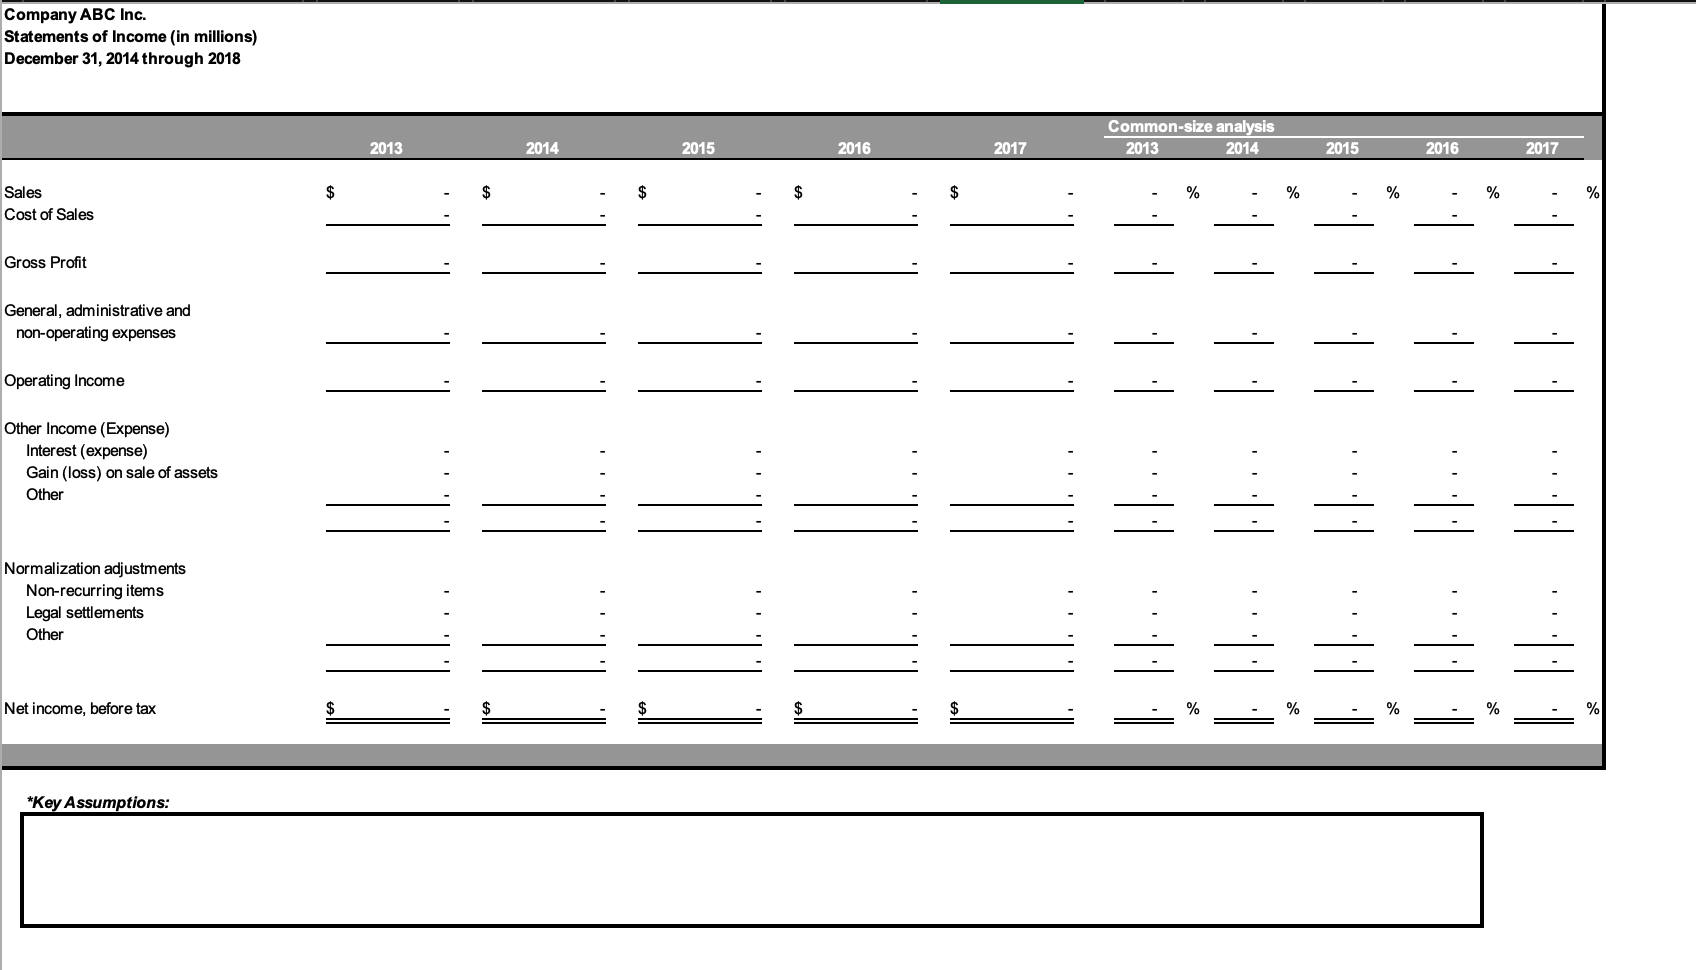
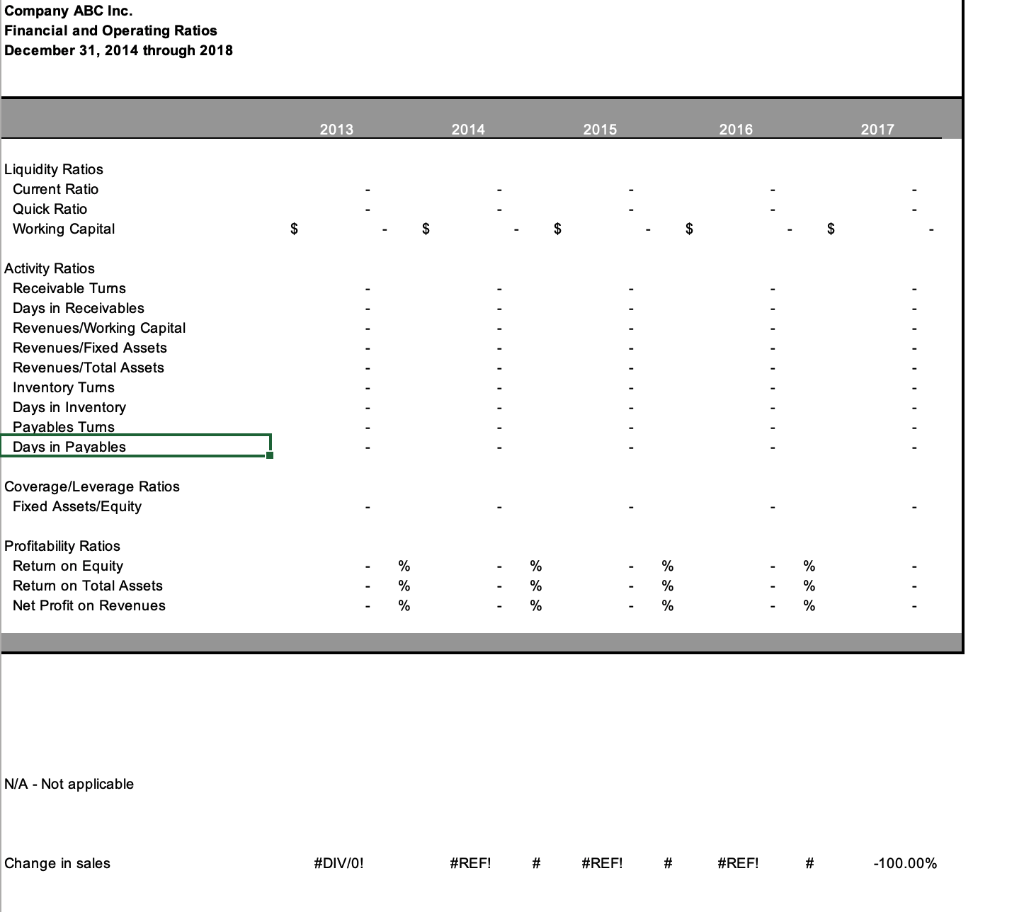
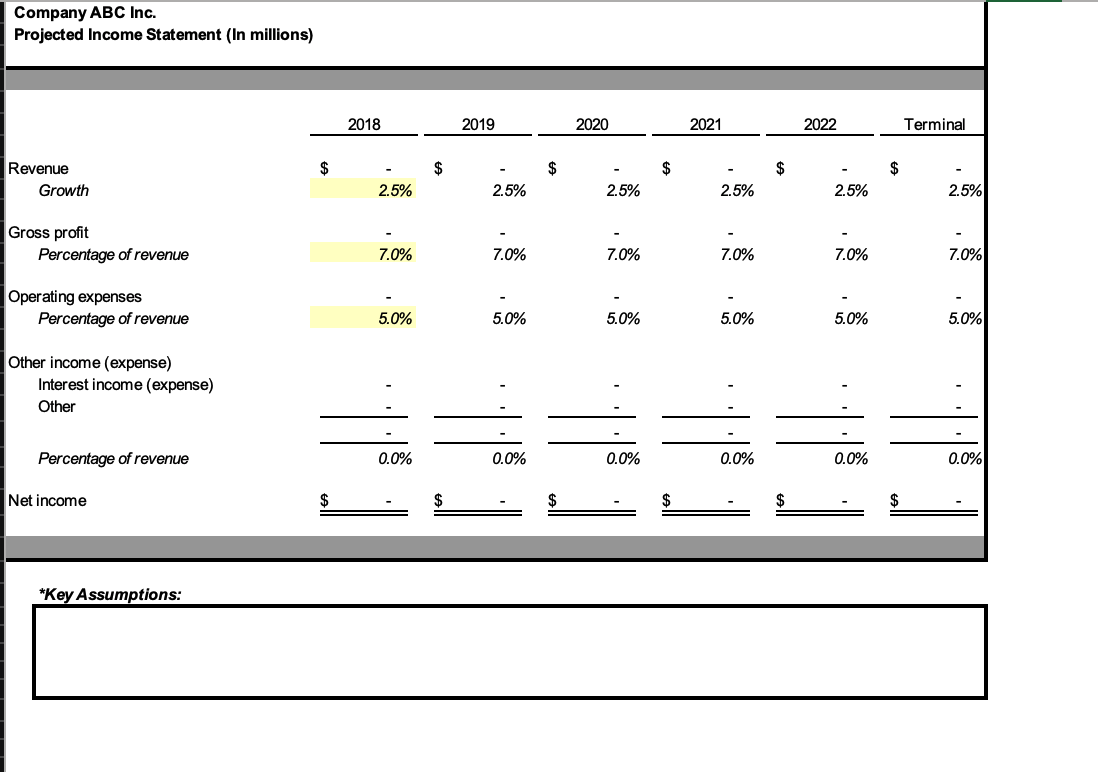
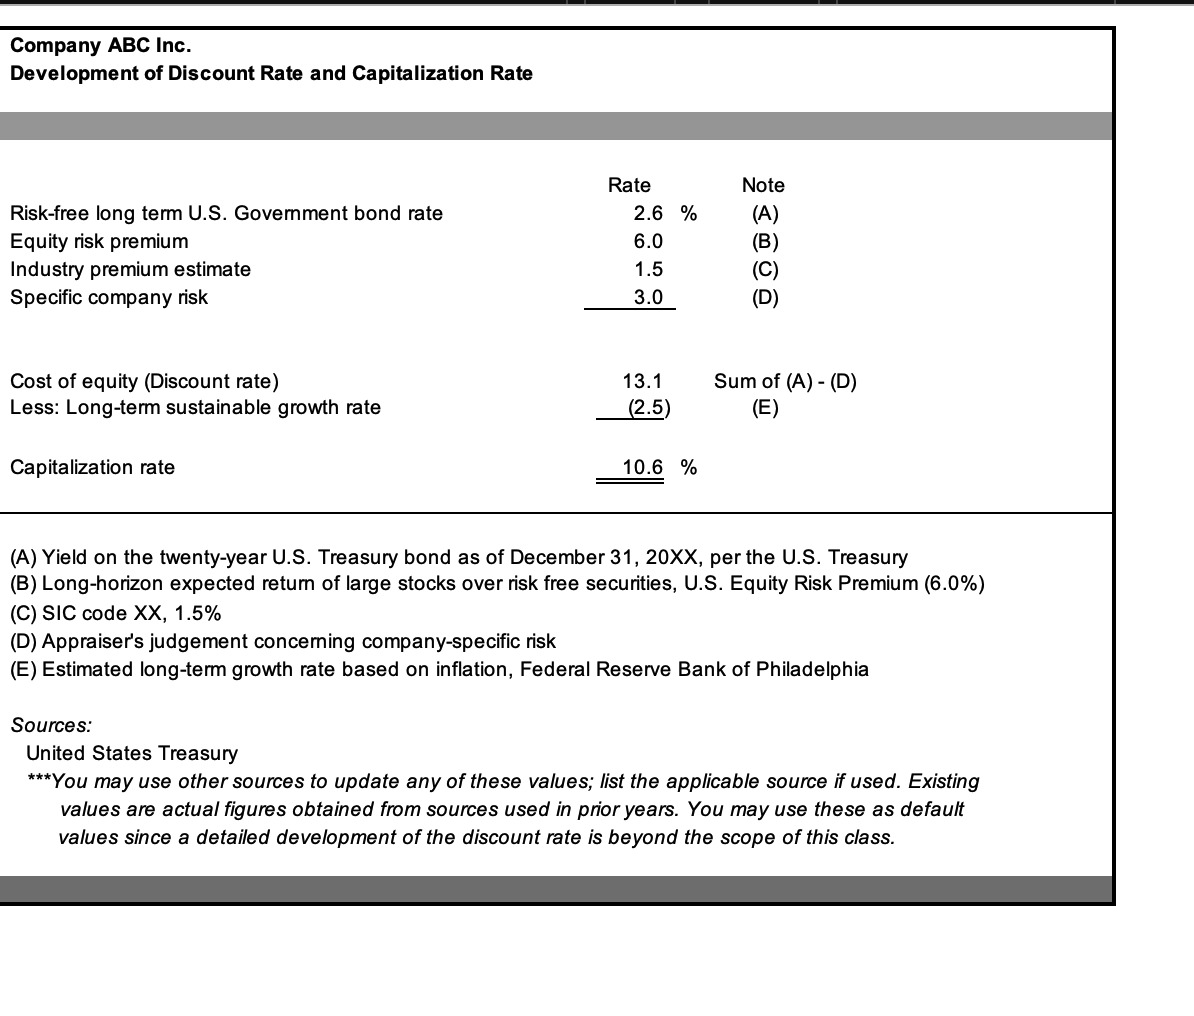
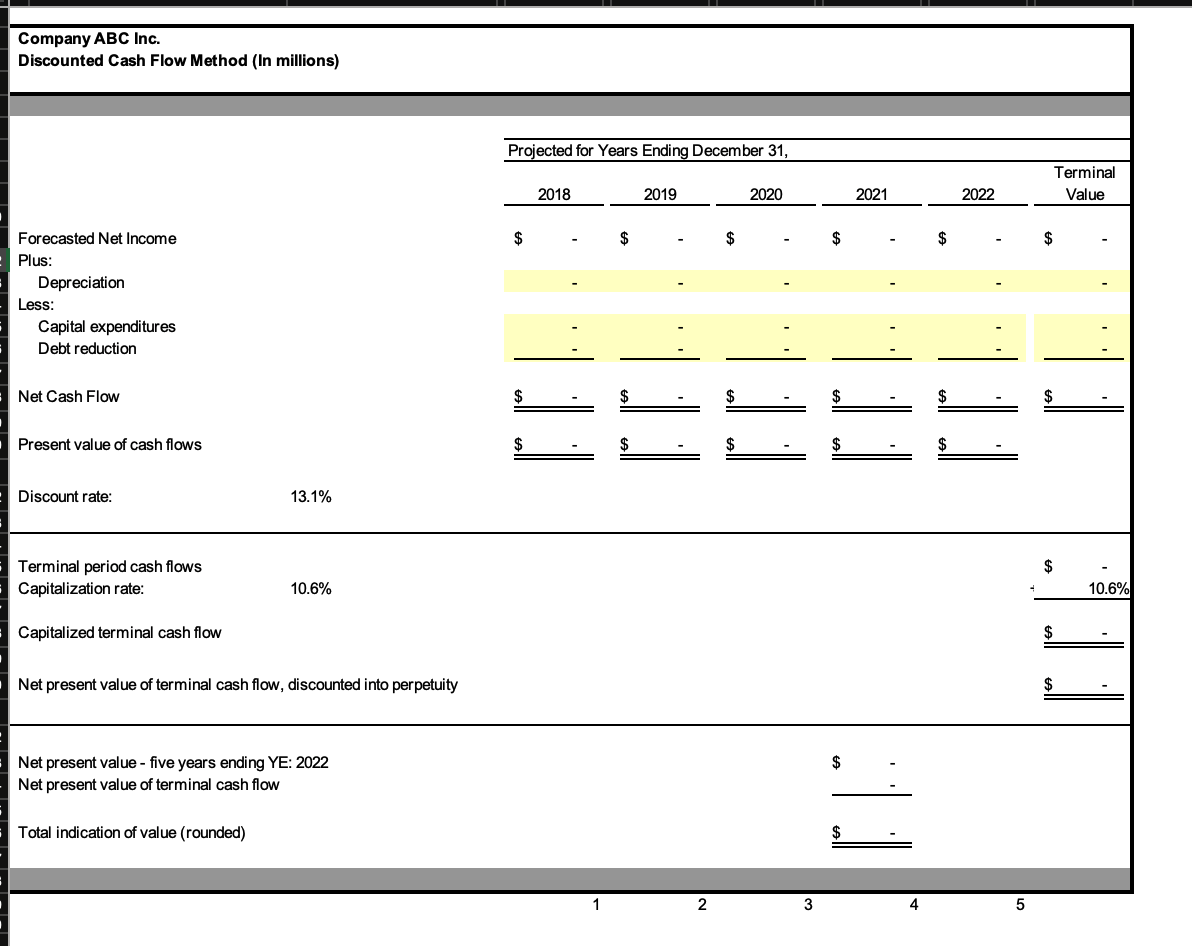
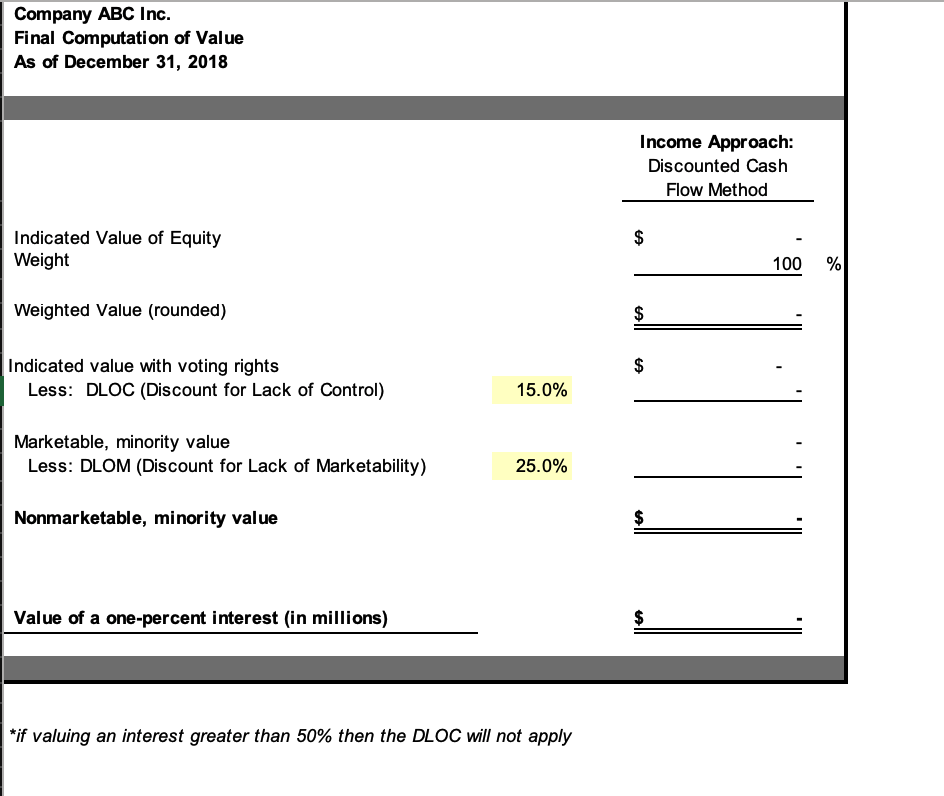
To begin follow these steps: 1. Enter the numbers from your company's balance sheet and income statement for each year, starting with the most recent year through the prior five years (Example: if the most recent is 2017 then go back through 2013). 2. Ratios auto-calculate but you may wish to make an adjustment if necessary. You will only use the ratios for explanatory or analysis purposes in your report. There is nothing more to do with them in this workbook. 3. Create your prospective analysis by changing the growth rate for Revenue, the percentage of Revenue for Gross Profit and Operating expenses, and then add Other Income or expense items. You can do this in the cells highlighted in yellow. This will give you your projected net income, which you will then use to discount to present value on the "dcf" tab later. The default number for Revenue in the prospective analysis is the most recent year's Revenue number plus 2.5%. You may change it. 4. On the "discount rate" tab you are welcome to leave the number as is or go through and make adjustments. In most cases you will need access to data that is unavailable or requires a paid subscription, which is why you're allowed to keep the default values. If you're able to obtain any of those figures then you may use them. The detail was provided to expose you to the concepts, but not actually require the research since it may be cost prohibitive. 5. The "dcf" tab feeds your projected Net Income figures from the "prospective analysis" tab. To that number you will add back depreciation since it's a non-cash item and then subtract expected capital expenditures or and planned debt reductions. You may estimate these if you're unable to find any projection by the company. It is not required that these be fully accurate since you don't have access to management's plans. Enter those numbers in the yellow highlighted cells. You shouldn't have to change any other cells in that tab. 6. On the last tab, "valuation summary", the only values you need to change are the cells in yellow for the DLOC and the DLOM. You may leave these as the default values since these also require access to data that may be only acquired via subscription or purchase. If you're able to find material supporting a change in those values then you're free to do so. The goal in introducing them in this manner is to get you exposed to the concepts, not the actual calculation as that is beyond the scope of this course. Consider these factors when working through the model: 1. The financial statements you encounter in the annual report will look differently than they do in this model. Categories will be different than what you find in the annual report, so just use your best judgement when classifying them and if you need to lump certain costs together then do so. (Example: your company shows Cost of Sales of $100k, G&A of $50k, and Marketing expense of $10k. Combine the G&A and Marketing in the single line on the income statement called "General, Administrative and other non-operating expenses" in the amount of $60k. This places Marketing into the "Other" catch all category. 2. You may insert any "Key Assumptions" that you want to convey using the space below the balance sheet, income statement, or prospective analysis. This could be anything from combining certain line items to explaining apparent anomalies. 3. Make sure to net your interest income and expense on the income statement. So in some years you may have a positive balance and a negative in others. 4. The "Normalization adjustments" listed on the "income statement" tab are referring to the adjustments discussed in module three. To recap - Normalization adjustments are changes that you as an analyst can make in order to "normalize" any anomalies or non-recurring items that may have been reported in the financial statements. For example, if your company was exposed to a natural disaster and you know management does not expect that type of major expense in the future then you can add it back under this section. Another example would be a class-action lawsuit that resulted in a major settlement. While companies are always subject to lawsuits, one that results in a material settlement may be removed if it's unexpected to occur again in the near future. Company ABC Inc. Balance Sheets (in millions) December 31, 2014 through 2018 Common-size analysis 2013 2014 2013 2014 2015 2016 2017 2015 2016 2017 Other comprehensive income (loss) Total Stockholders' Equity EE $ $ $ % % % % % $ $ $ $ $ *Key Assumptions: Company ABC Inc. Statements of Income in millions) December 31, 2014 through 2018 Common-size analysis 2013 2014 2013 2014 2015 2016 2017 2015 2016 2017 % % % % Sales Cost of Sales Gross Profit 1 General, administrative and non-operating expenses Operating Income Other Income (Expense) Interest (expense) Gain (loss) on sale of assets Other 1: Normalization adjustments Non-recurring items Legal settlements Other Net income, before tax $ % *Key Assumptions: Company ABC Inc. Financial and Operating Ratios December 31, 2014 through 2018 2013 2014 2015 2016 2017 Liquidity Ratios Current Ratio Quick Ratio Working Capital $ $ $ Activity Ratios Receivable Tums Days in Receivables Revenues/Working Capital Revenues/Fixed Assets Revenues/Total Assets Inventory Tums Days in Inventory Payables Tums Days in Payables Coverage/Leverage Ratios Fixed Assets/Equity Profitability Ratios Retum on Equity Retum on Total Assets Net Profit on Revenues % % % % % % % % % % % % NA - Not applicable Change in sales # DIV/0! #DIV/0! #REF! # #REF! # #REF! # -100.00% Company ABC Inc. Projected Income Statement (In millions) 2018 2019 2020 2021 2022 Terminal $ $ $ $ $ $ Revenue Growth 2.5% 2.5% 2.5% 2.5% 2.5% 2.5% Gross profit Percentage of revenue 7.0% 7.0% 7.0% 7.0% 7.0% 7.0% Operating expenses Percentage of revenue 5.0% 5.0% 5.0% 5.0% 5.0% 5.0% Other income (expense) Interest income (expense) Other Percentage of revenue 0.0% 0.0% 0.0% 0.0% 0.0% 0.0% Net income $ *Key Assumptions: Company ABC Inc. Development of Discount Rate and Capitalization Rate Risk-free long term U.S. Government bond rate Equity risk premium Industry premium estimate Specific company risk Rate 2.6 % 6.0 1.5 3.0 Note (A) (B) (C) (D) Cost of equity (Discount rate) Less: Long-term sustainable growth rate 13.1 (2.5) Sum of (A) - (D) (E) Capitalization rate 10.6 % (A) Yield on the twenty-year U.S. Treasury bond as of December 31, 20XX, per the U.S. Treasury (B) Long-horizon expected return of large stocks over risk free securities, U.S. Equity Risk Premium (6.0%) (C) SIC code XX, 1.5% (D) Appraiser's judgement concerning company-specific risk (E) Estimated long-term growth rate based on inflation, Federal Reserve Bank of Philadelphia Sources: United States Treasury ***You may use other sources to update any of these values; list the applicable source if used. Existing values are actual figures obtained from sources used in prior years. You may use these as default values since a detailed development of the discount rate is beyond the scope of this class. Company ABC Inc. Discounted Cash Flow Method (In millions) Projected for Years Ending December 31, Terminal Value 2018 2019 2020 2021 2022 $ $ $ $ $ Forecasted Net Income Plus: Depreciation Less: Capital expenditures Debt reduction Net Cash Flow $ $ ES Present value of cash flows $ $ $ $ Discount rate: 13.1% $ Terminal period cash flows Capitalization rate: 10.6% 10.6% Capitalized terminal cash flow $ Net present value of terminal cash flow, discounted into perpetuity $ Net present value - five years ending YE: 2022 Net present value of terminal cash flow Total indication of value (rounded) 2 3 4 5 Company ABC Inc. Final Computation of Value As of December 31, 2018 Income Approach: Discounted Cash Flow Method $ Indicated Value of Equity Weight 100 % Weighted Value (rounded) $ $ $ Indicated value with voting rights Less: DLOC (Discount for Lack of Control) 15.0% Marketable, minority value Less: DLOM (Discount for Lack of Marketability) 25.0% Nonmarketable, minority value $ Value of a one-percent interest (in millions) all $ *if valuing an interest greater than 50% then the DLOC will not apply To begin follow these steps: 1. Enter the numbers from your company's balance sheet and income statement for each year, starting with the most recent year through the prior five years (Example: if the most recent is 2017 then go back through 2013). 2. Ratios auto-calculate but you may wish to make an adjustment if necessary. You will only use the ratios for explanatory or analysis purposes in your report. There is nothing more to do with them in this workbook. 3. Create your prospective analysis by changing the growth rate for Revenue, the percentage of Revenue for Gross Profit and Operating expenses, and then add Other Income or expense items. You can do this in the cells highlighted in yellow. This will give you your projected net income, which you will then use to discount to present value on the "dcf" tab later. The default number for Revenue in the prospective analysis is the most recent year's Revenue number plus 2.5%. You may change it. 4. On the "discount rate" tab you are welcome to leave the number as is or go through and make adjustments. In most cases you will need access to data that is unavailable or requires a paid subscription, which is why you're allowed to keep the default values. If you're able to obtain any of those figures then you may use them. The detail was provided to expose you to the concepts, but not actually require the research since it may be cost prohibitive. 5. The "dcf" tab feeds your projected Net Income figures from the "prospective analysis" tab. To that number you will add back depreciation since it's a non-cash item and then subtract expected capital expenditures or and planned debt reductions. You may estimate these if you're unable to find any projection by the company. It is not required that these be fully accurate since you don't have access to management's plans. Enter those numbers in the yellow highlighted cells. You shouldn't have to change any other cells in that tab. 6. On the last tab, "valuation summary", the only values you need to change are the cells in yellow for the DLOC and the DLOM. You may leave these as the default values since these also require access to data that may be only acquired via subscription or purchase. If you're able to find material supporting a change in those values then you're free to do so. The goal in introducing them in this manner is to get you exposed to the concepts, not the actual calculation as that is beyond the scope of this course. Consider these factors when working through the model: 1. The financial statements you encounter in the annual report will look differently than they do in this model. Categories will be different than what you find in the annual report, so just use your best judgement when classifying them and if you need to lump certain costs together then do so. (Example: your company shows Cost of Sales of $100k, G&A of $50k, and Marketing expense of $10k. Combine the G&A and Marketing in the single line on the income statement called "General, Administrative and other non-operating expenses" in the amount of $60k. This places Marketing into the "Other" catch all category. 2. You may insert any "Key Assumptions" that you want to convey using the space below the balance sheet, income statement, or prospective analysis. This could be anything from combining certain line items to explaining apparent anomalies. 3. Make sure to net your interest income and expense on the income statement. So in some years you may have a positive balance and a negative in others. 4. The "Normalization adjustments" listed on the "income statement" tab are referring to the adjustments discussed in module three. To recap - Normalization adjustments are changes that you as an analyst can make in order to "normalize" any anomalies or non-recurring items that may have been reported in the financial statements. For example, if your company was exposed to a natural disaster and you know management does not expect that type of major expense in the future then you can add it back under this section. Another example would be a class-action lawsuit that resulted in a major settlement. While companies are always subject to lawsuits, one that results in a material settlement may be removed if it's unexpected to occur again in the near future. Company ABC Inc. Balance Sheets (in millions) December 31, 2014 through 2018 Common-size analysis 2013 2014 2013 2014 2015 2016 2017 2015 2016 2017 Other comprehensive income (loss) Total Stockholders' Equity EE $ $ $ % % % % % $ $ $ $ $ *Key Assumptions: Company ABC Inc. Statements of Income in millions) December 31, 2014 through 2018 Common-size analysis 2013 2014 2013 2014 2015 2016 2017 2015 2016 2017 % % % % Sales Cost of Sales Gross Profit 1 General, administrative and non-operating expenses Operating Income Other Income (Expense) Interest (expense) Gain (loss) on sale of assets Other 1: Normalization adjustments Non-recurring items Legal settlements Other Net income, before tax $ % *Key Assumptions: Company ABC Inc. Financial and Operating Ratios December 31, 2014 through 2018 2013 2014 2015 2016 2017 Liquidity Ratios Current Ratio Quick Ratio Working Capital $ $ $ Activity Ratios Receivable Tums Days in Receivables Revenues/Working Capital Revenues/Fixed Assets Revenues/Total Assets Inventory Tums Days in Inventory Payables Tums Days in Payables Coverage/Leverage Ratios Fixed Assets/Equity Profitability Ratios Retum on Equity Retum on Total Assets Net Profit on Revenues % % % % % % % % % % % % NA - Not applicable Change in sales # DIV/0! #DIV/0! #REF! # #REF! # #REF! # -100.00% Company ABC Inc. Projected Income Statement (In millions) 2018 2019 2020 2021 2022 Terminal $ $ $ $ $ $ Revenue Growth 2.5% 2.5% 2.5% 2.5% 2.5% 2.5% Gross profit Percentage of revenue 7.0% 7.0% 7.0% 7.0% 7.0% 7.0% Operating expenses Percentage of revenue 5.0% 5.0% 5.0% 5.0% 5.0% 5.0% Other income (expense) Interest income (expense) Other Percentage of revenue 0.0% 0.0% 0.0% 0.0% 0.0% 0.0% Net income $ *Key Assumptions: Company ABC Inc. Development of Discount Rate and Capitalization Rate Risk-free long term U.S. Government bond rate Equity risk premium Industry premium estimate Specific company risk Rate 2.6 % 6.0 1.5 3.0 Note (A) (B) (C) (D) Cost of equity (Discount rate) Less: Long-term sustainable growth rate 13.1 (2.5) Sum of (A) - (D) (E) Capitalization rate 10.6 % (A) Yield on the twenty-year U.S. Treasury bond as of December 31, 20XX, per the U.S. Treasury (B) Long-horizon expected return of large stocks over risk free securities, U.S. Equity Risk Premium (6.0%) (C) SIC code XX, 1.5% (D) Appraiser's judgement concerning company-specific risk (E) Estimated long-term growth rate based on inflation, Federal Reserve Bank of Philadelphia Sources: United States Treasury ***You may use other sources to update any of these values; list the applicable source if used. Existing values are actual figures obtained from sources used in prior years. You may use these as default values since a detailed development of the discount rate is beyond the scope of this class. Company ABC Inc. Discounted Cash Flow Method (In millions) Projected for Years Ending December 31, Terminal Value 2018 2019 2020 2021 2022 $ $ $ $ $ Forecasted Net Income Plus: Depreciation Less: Capital expenditures Debt reduction Net Cash Flow $ $ ES Present value of cash flows $ $ $ $ Discount rate: 13.1% $ Terminal period cash flows Capitalization rate: 10.6% 10.6% Capitalized terminal cash flow $ Net present value of terminal cash flow, discounted into perpetuity $ Net present value - five years ending YE: 2022 Net present value of terminal cash flow Total indication of value (rounded) 2 3 4 5 Company ABC Inc. Final Computation of Value As of December 31, 2018 Income Approach: Discounted Cash Flow Method $ Indicated Value of Equity Weight 100 % Weighted Value (rounded) $ $ $ Indicated value with voting rights Less: DLOC (Discount for Lack of Control) 15.0% Marketable, minority value Less: DLOM (Discount for Lack of Marketability) 25.0% Nonmarketable, minority value $ Value of a one-percent interest (in millions) all $ *if valuing an interest greater than 50% then the DLOC will not apply
Step by Step Solution
There are 3 Steps involved in it

Get step-by-step solutions from verified subject matter experts