

Question: I need help with getting the ratios for 2018 and 2019. These are the balance and income statements for Target corp. 1. Using the financial
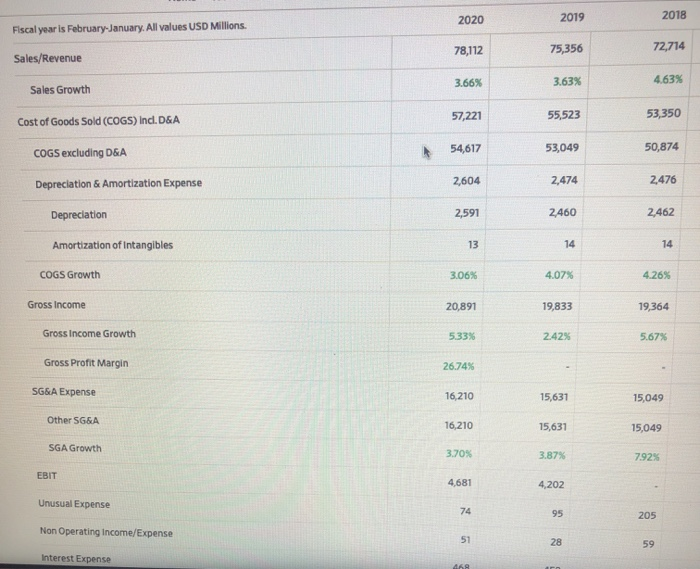
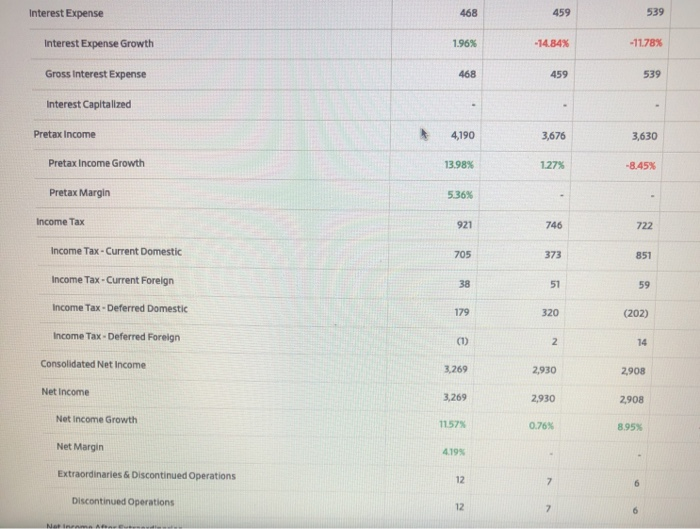
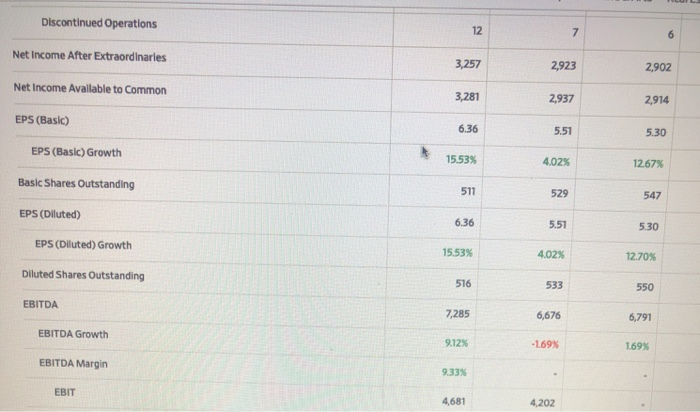
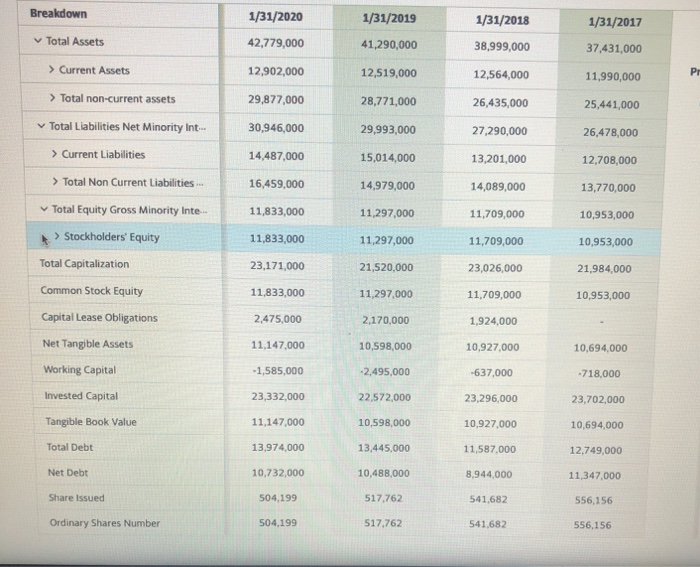
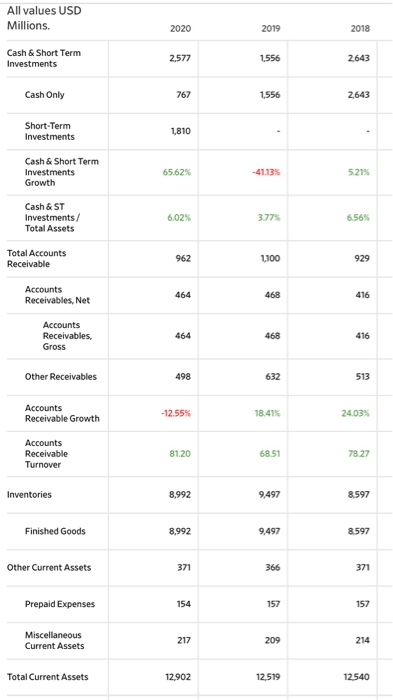
1. Using the financial statements of your selected company, give a brief explanation of each ratio, how it is used in business performance evaluation. Compute each of following ratios for the most recent year and the previous year. Assume all sales are credit sales. Round all ratios to two decimal places. a. Current ratio b. Cash ratio C. Inventory turnover d. Accounts receivable turnover e. Gross profit percentage f. Debt ratio g. Debt to equity ratio h. Profit margin ratio 1. Asset turnover ratio J. Rate of return on common stockholders' equity k. Earnings per share 1. Price/earnings ratio m. Dividend yield n. Dividend payout 2020 2019 2018 Fiscal year is February January. All values USD Millions. 78,112 75,356 72,714 Sales/Revenue 3.66% 3.63% 4.63% Sales Growth 57,221 55,523 53,350 Cost of Goods Sold (COGS) Ind. D&A COGS excluding D&A 54,617 53,049 50,874 Depreciation & Amortization Expense 2,604 2,474 2476 Depreciation 2,591 2460 2,462 Amortization of Intangibles 13 14 14 COGS Growth 3.06% 4.07% 4.26% Gross Income 20,891 19,833 19,364 Gross Income Growth 5.33% 2.42% 5.67% Gross Profit Margin 26.74% SG&A Expense 16,210 15,631 15,049 Other SG&A 16,210 15,631 15,049 SGA Growth 3.70% 3.87% 7.92% EBIT 4,681 4,202 Unusual Expense 74 95 205 Non Operating income/Expense 51 28 59 Interest Expense 468 Interest Expense 468 459 539 Interest Expense Growth 1.96% -14.84% -11.78% Gross interest Expense 468 459 539 Interest Capitalized Pretax Income 4,190 3,676 3,630 Pretax Income Growth 13.98% 1.27% -8.45% Pretax Margin 5.36% Income Tax 921 746 722 Income Tax - Current Domestic 705 373 851 Income Tax - Current Foreign 38 51 59 Income Tax - Deferred Domestic 179 320 (202) Income Tax-Deferred Foreign (1) 2 14 Consolidated Net Income 3.269 2,930 2,908 Net Income 3,269 2,930 2,908 Net Income Growth 1157% 0.76% 8.95% Net Margin 4.19% Extraordinaries & Discontinued Operations 12 7 6 Discontinued Operations 12 7 6 Na A Discontinued Operations 12 7 6 Net Income After Extraordinaries 3,257 2,923 2,902 Net Income Available to Common 3,281 2,937 2,914 EPS (Basic) 6.36 5.51 5.30 EPS (Basic) Growth 15.53% 4.02% 12.67% Basic Shares Outstanding 511 529 547 EPS (Diluted) 6.36 5.51 5.30 EPS (Diluted) Growth 15.53% 4.02% 12.70% Diluted Shares Outstanding 516 533 550 EBITDA 7,285 6,676 6,791 EBITDA Growth 9.12% -1.69% 169% EBITDA Margin 9.33% EBIT 4,681 4,202 Breakdown 1/31/2020 1/31/2019 1/31/2018 1/31/2017 Total Assets 42,779,000 41,290,000 38,999,000 37,431,000 > Current Assets 12,902,000 12,519,000 12,564,000 Pr 11,990,000 > Total non-current assets 29,877,000 28,771,000 26,435,000 25,441,000 30,946,000 29,993,000 27,290,000 26,478,000 14,487,000 15,014,000 13,201,000 12,708,000 16,459,000 14,979,000 14,089,000 13,770,000 11,833,000 11,297,000 11,709,000 10,953,000 11,833,000 11,297,000 11,709,000 10,953,000 23,171,000 Total Liabilities Net Minority Int... > Current Liabilities > Total Non Current Liabilities... Total Equity Gross Minority Inte.. > Stockholders' Equity Total Capitalization Common Stock Equity Capital Lease Obligations Net Tangible Assets Working Capital Invested Capital Tangible Book Value 21,520,000 21,984,000 23,026,000 11,709,000 11,833,000 11,297,000 10,953,000 2,475,000 2,170,000 1,924,000 11,147,000 10,598,000 10,927,000 10,694,000 -1,585,000 -2,495.000 -637,000 -718,000 23,332,000 22,572,000 23,296,000 23,702,000 11,147,000 10,598,000 10.927.000 10,694,000 Total Debt 13,974,000 13,445,000 11,587,000 12,749,000 Net Debt 10,732,000 10,488,000 8.944,000 11,347,000 Share Issued 504,199 517.762 541.682 556,156 Ordinary Shares Number 504,199 517,762 541,682 556,156 All values USD Millions. 2020 2019 2018 Cash & Short Term Investments 2.577 1.556 2.643 Cash Only 767 1.556 2643 Short-Term Investments 1,810 Cash & Short Term Investments Growth 65.62% -41.135 5.21% Cash & ST Investments/ Total Assets 6,025 3.77% 6.56% Total Accounts Receivable 962 1100 929 Accounts Receivables, Net 464 468 416 Accounts Receivables, Gross 464 468 416 Other Receivables 498 632 513 Accounts Receivable Growth -12.55% 18.41% 24.03% Accounts Receivable Turnover 81.20 68.51 78.27 Inventories 8,992 9,497 8.597 Finished Goods 8.992 9,497 8.597 Other Current Assets 371 366 371 Prepaid Expenses 154 157 157 Miscellaneous Current Assets 217 209 214 Total Current Assets 12,902 12.519 12.540
Step by Step Solution
There are 3 Steps involved in it

Get step-by-step solutions from verified subject matter experts