

Question: I need help with how to interpret the horizontal, vertical, and ratio analysis with 3 categories only on horizonal, vertical, and ratio analysis with 2-3
I need help with how to interpret the horizontal, vertical, and ratio analysis with 3 categories only on horizonal, vertical, and ratio analysis with 2-3 sentences for each category. I need help to (a) provide the result, (b) indicate whether this is good or bad, and (c) discuss trends if possible.
With the categories, I do not know which 3 categories on each analysis to choose and how to interpret them. PLEASE HELP!
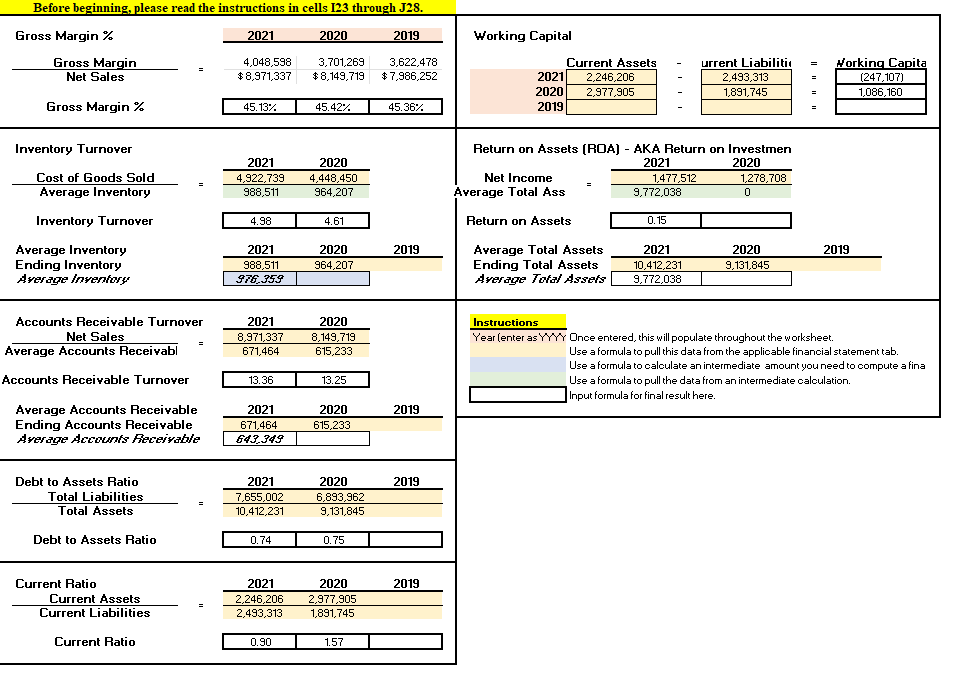
This one is the Ratio Analysis. I just need 3 different categories to be interpreted in 2-3 sentences.
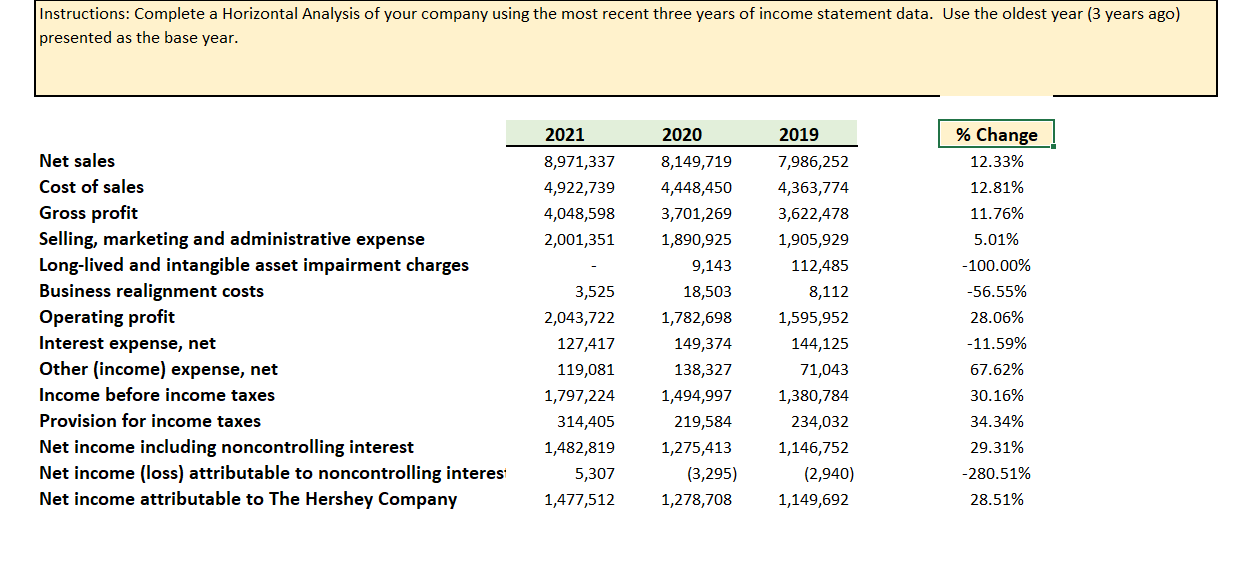
This one is the Horizontal Analysis. I just need 3 different categories to be interpreted in 2-3 sentences.
This one is the Vertical Analysis. I just need 3 different categories to be interpreted in 2-3 sentences.
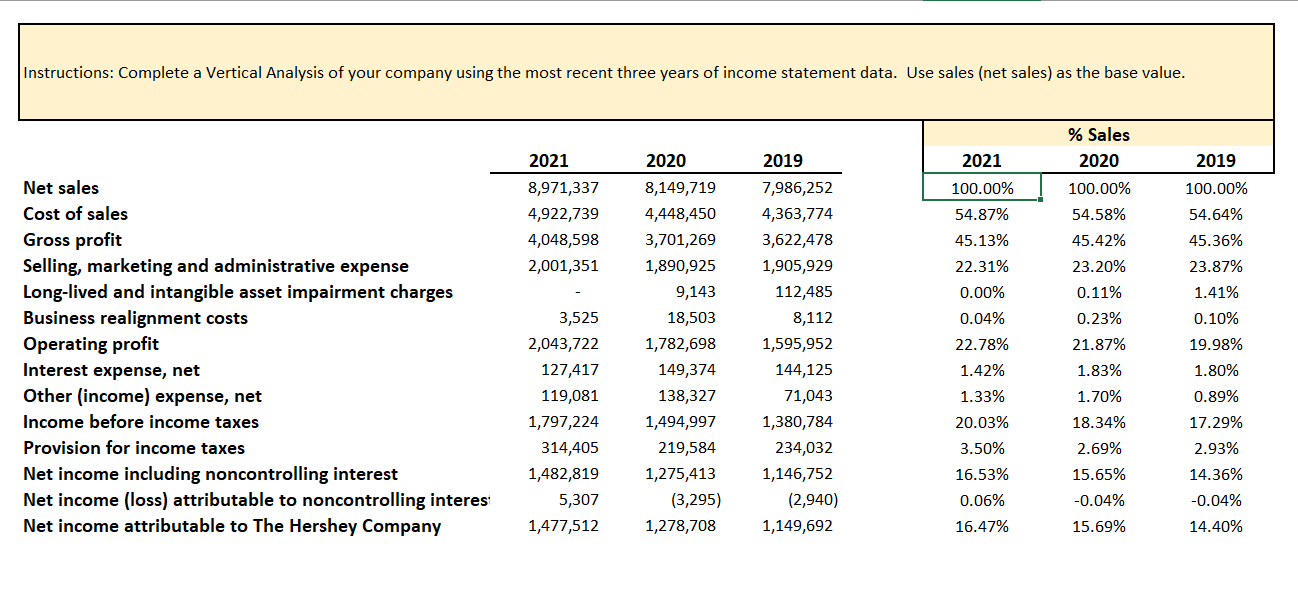
Before beginning, please read the instructions in cells 123 through J28. Gross Margin % 2021 2020 2019 Working Capital = Gross Margin Net Sales 4,048,598 $ 8,971,337 3,701,269 $8,149,719 3,622,478 $ 7,986,252 Current Assets 20211 2,246.206 2020 2,977,905 2019 urrent Liabiliti 2,493,313 1,891.745 Working Capita (247,107) 1,086,160 Gross Margin % 45.13%. 45.42% 45.36% Inventory Turnover Cost of Goods Sold Average Inventory 2021 4,922,739 988,511 2020 4,448,450 964,207 Return on Assets (ROA) - AKA Return on Investmen 2021 2020 Net Income 1,477,512 1,278,708 Average Total Ass 9,772,038 0 0 Inventory Turnover 4.98 4.61 Return on Assets 0.15 2019 2019 Average Inventory Ending Inventory Average Inventory 2021 988,511 976.359 2020 964,207 Average Total Assets Ending Total Assets Average Total Assets 2021 10,412,231 9,772,038 2020 9,131,845 Accounts Receivable Turnover Net Sales Average Accounts Receivabl 2021 8,971,337 671,464 2020 8,149,719 615,233 Instructions Year (enter as YYYY Once entered, this will populate throughout the worksheet. Use a formula to pull this data from the applicable financial statement tab. Use a formula to calculate an intermediate amount you need to compute a fina Use a formula to pull the data from an intermediate calculation. Input formula for final result here. Accounts Receivable Turnover 13.36 13.25 2019 Average Accounts Receivable Ending Accounts Receivable Average Accounts Receivable 2021 671,464 643.349 2020 615,233 2019 Debt to Assets Ratio Total Liabilities Total Assets 2021 7,655,002 10,412,231 2020 6,893,962 9,131,845 Debt to Assets Ratio 0.74 0.75 2019 Current Ratio Current Assets Current Liabilities 2021 2,246,206 2,493,313 2020 2,977,905 1,891,745 Current Ratio 0.90 1.57 Instructions: Complete a Horizontal Analysis of your company using the most recent three years of income statement data. Use the oldest year (3 years ago) presented as the base year. 2021 2020 2019 8,971,337 4,922,739 4,048,598 2,001,351 Net sales Cost of sales Gross profit Selling, marketing and administrative expense Long-lived and intangible asset impairment charges Business realignment costs Operating profit Interest expense, net Other (income) expense, net Income before income taxes Provision for income taxes Net income including noncontrolling interest Net income (loss) attributable to noncontrolling interest Net income attributable to The Hershey Company 3,525 2,043,722 127,417 119,081 1,797,224 314,405 1,482,819 5,307 1,477,512 8,149,719 4,448,450 3,701,269 1,890,925 9,143 18,503 1,782,698 149,374 138,327 1,494,997 219,584 1,275,413 (3,295) 1,278,708 7,986,252 4,363,774 3,622,478 1,905,929 112,485 8,112 1,595,952 144,125 71,043 1,380,784 234,032 1,146,752 (2,940) 1,149,692 % Change 12.33% 12.81% 11.76% 5.01% -100.00% -56.55% 28.06% -11.59% 67.62% 30.16% 34.34% 29.31% -280.51% 28.51% Instructions: Complete a Vertical Analysis of your company using the most recent three years of income statement data. Use sales (net sales) as the base value. % Sales 2020 2021 2019 2021 8,971,337 4,922,739 4,048,598 2,001,351 100.00% 54.87% 45.13% 100.00% 54.58% 100.00% 54.64% 45.36% 23.87% 1.41% 45.42% 23.20% 0.11% 22.31% Net sales Cost of sales Gross profit Selling, marketing and administrative expense Long-lived and intangible asset impairment charges Business realignment costs Operating profit Interest expense, net Other (income) expense, net Income before income taxes Provision for income taxes Net income including noncontrolling interest Net income (loss) attributable to noncontrolling interes Net income attributable to The Hershey Company 2020 8,149,719 4,448,450 3,701,269 1,890,925 9,143 18,503 1,782,698 149,374 138,327 1,494,997 219,584 1,275,413 (3,295) 1,278,708 3,525 2,043,722 127,417 119,081 1,797,224 314,405 1,482,819 5,307 1,477,512 0.23% 21.87% 2019 7,986,252 4,363,774 3,622,478 1,905,929 112,485 8,112 1,595,952 144,125 71,043 1,380,784 234,032 1,146,752 (2,940) 1,149,692 0.00% 0.04% 22.78% 1.42% 1.33% 20.03% 3.50% 16.53% 0.06% 16.47% 1.83% 1.70% 18.34% 2.69% 15.65% -0.04% 15.69% 0.10% 19.98% 1.80% 0.89% 17.29% 2.93% 14.36% -0.04% 14.40%
Step by Step Solution
There are 3 Steps involved in it

Get step-by-step solutions from verified subject matter experts