

Question: I need help with how to interpret the horizontal, vertical, and ratio analysis which I have provided with the last pictures. I only need 3
I need help with how to interpret the horizontal, vertical, and ratio analysis which I have provided with the last pictures. I only need 3 different parts to be analyzed with 2-3 sentences. I need help to (a) provide the result, (b) indicate whether this is good or bad, and (c) discuss trends if possible.
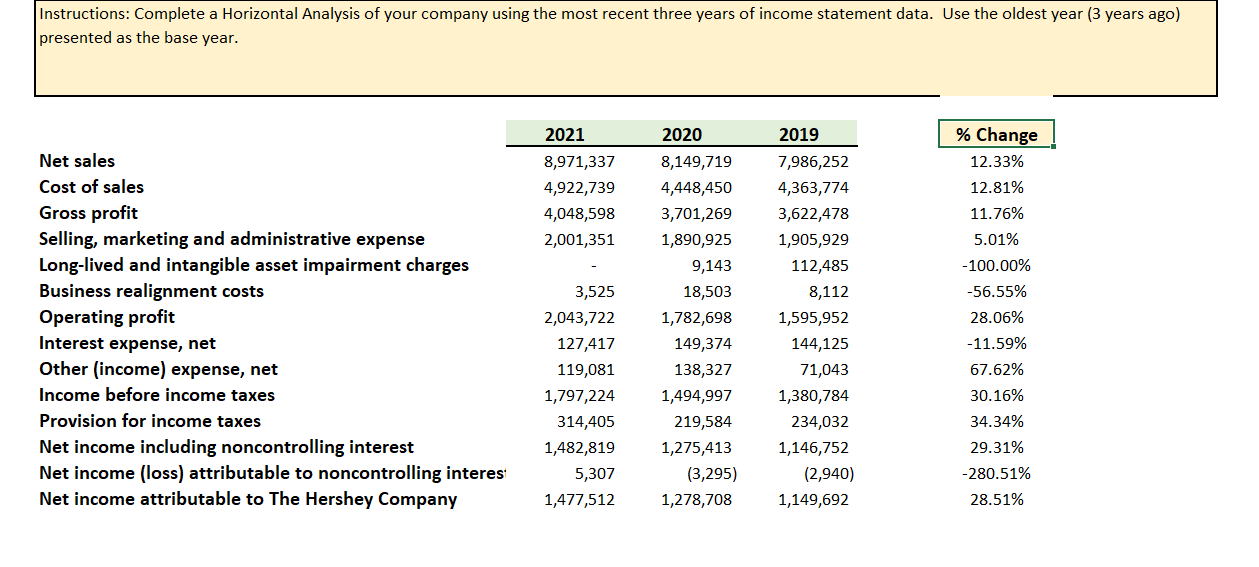
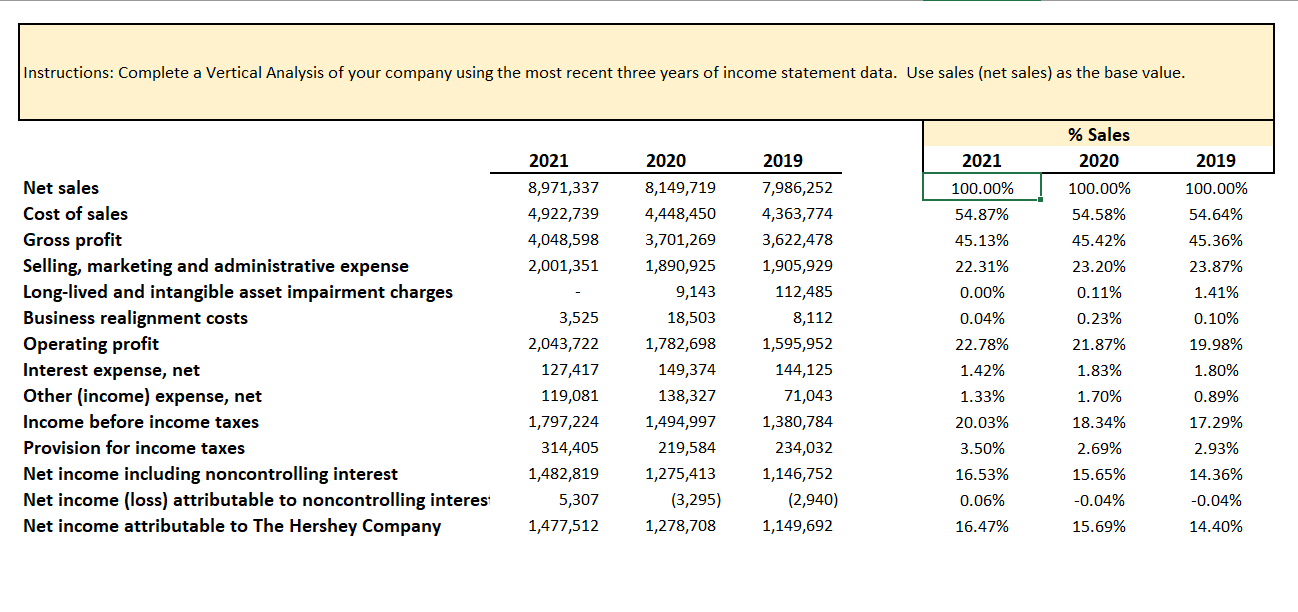
Instructions: Complete a Horizontal Analysis of your company using the most recent three years of income statement data. Use the oldest year (3 years ago) presented as the base year. 2021 2020 2019 8,971,337 4,922,739 4,048,598 2,001,351 Net sales Cost of sales Gross profit Selling, marketing and administrative expense Long-lived and intangible asset impairment charges Business realignment costs Operating profit Interest expense, net Other (income) expense, net Income before income taxes Provision for income taxes Net income including noncontrolling interest Net income (loss) attributable to noncontrolling interest Net income attributable to The Hershey Company 3,525 2,043,722 127,417 119,081 1,797,224 314,405 1,482,819 5,307 1,477,512 8,149,719 4,448,450 3,701,269 1,890,925 9,143 18,503 1,782,698 149,374 138,327 1,494,997 219,584 1,275,413 (3,295) 1,278,708 7,986,252 4,363,774 3,622,478 1,905,929 112,485 8,112 1,595,952 144,125 71,043 1,380,784 234,032 1,146,752 (2,940) 1,149,692 % Change 12.33% 12.81% 11.76% 5.01% -100.00% -56.55% 28.06% -11.59% 67.62% 30.16% 34.34% 29.31% -280.51% 28.51% Instructions: Complete a Vertical Analysis of your company using the most recent three years of income statement data. Use sales (net sales) as the base value. % Sales 2020 2021 2019 2021 8,971,337 4,922,739 4,048,598 2,001,351 100.00% 54.87% 45.13% 100.00% 54.58% 100.00% 54.64% 45.36% 23.87% 1.41% 45.42% 23.20% 0.11% 22.31% Net sales Cost of sales Gross profit Selling, marketing and administrative expense Long-lived and intangible asset impairment charges Business realignment costs Operating profit Interest expense, net Other (income) expense, net Income before income taxes Provision for income taxes Net income including noncontrolling interest Net income (loss) attributable to noncontrolling interes Net income attributable to The Hershey Company 2020 8,149,719 4,448,450 3,701,269 1,890,925 9,143 18,503 1,782,698 149,374 138,327 1,494,997 219,584 1,275,413 (3,295) 1,278,708 3,525 2,043,722 127,417 119,081 1,797,224 314,405 1,482,819 5,307 1,477,512 0.23% 21.87% 2019 7,986,252 4,363,774 3,622,478 1,905,929 112,485 8,112 1,595,952 144,125 71,043 1,380,784 234,032 1,146,752 (2,940) 1,149,692 0.00% 0.04% 22.78% 1.42% 1.33% 20.03% 3.50% 16.53% 0.06% 16.47% 1.83% 1.70% 18.34% 2.69% 15.65% -0.04% 15.69% 0.10% 19.98% 1.80% 0.89% 17.29% 2.93% 14.36% -0.04% 14.40%
Step by Step Solution
There are 3 Steps involved in it

Get step-by-step solutions from verified subject matter experts