

Question: I need help with market value ratios please Market Value Ratios - Earnings per Share (EPS) - Price Earnings (PE) 5. Using the data from
I need help with market value ratios please
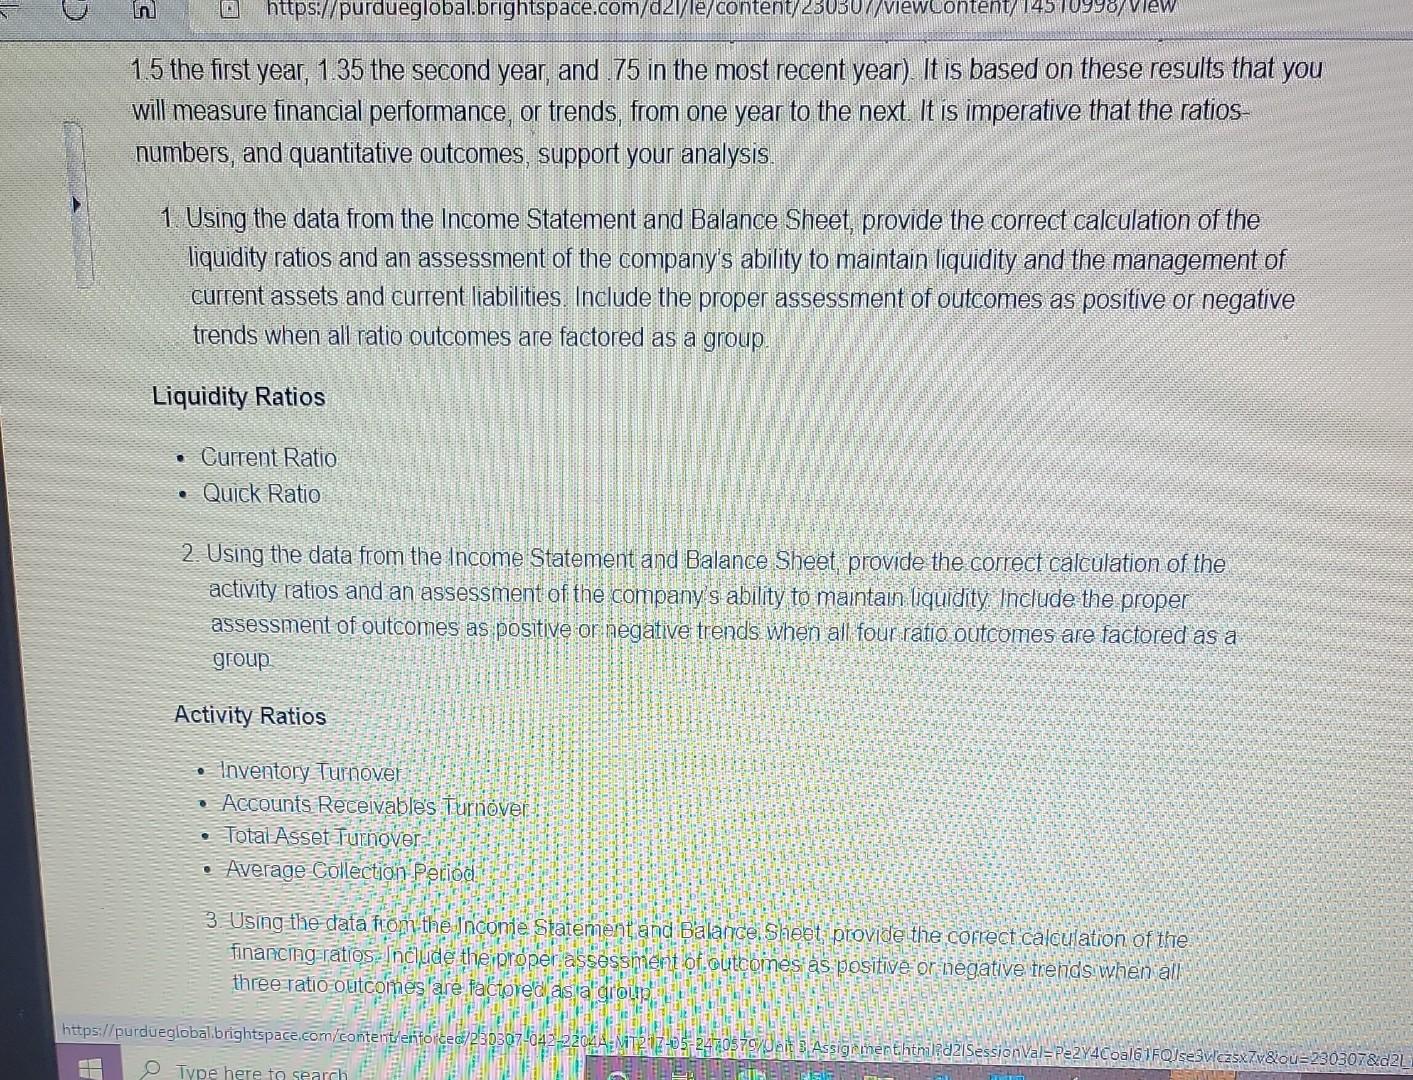
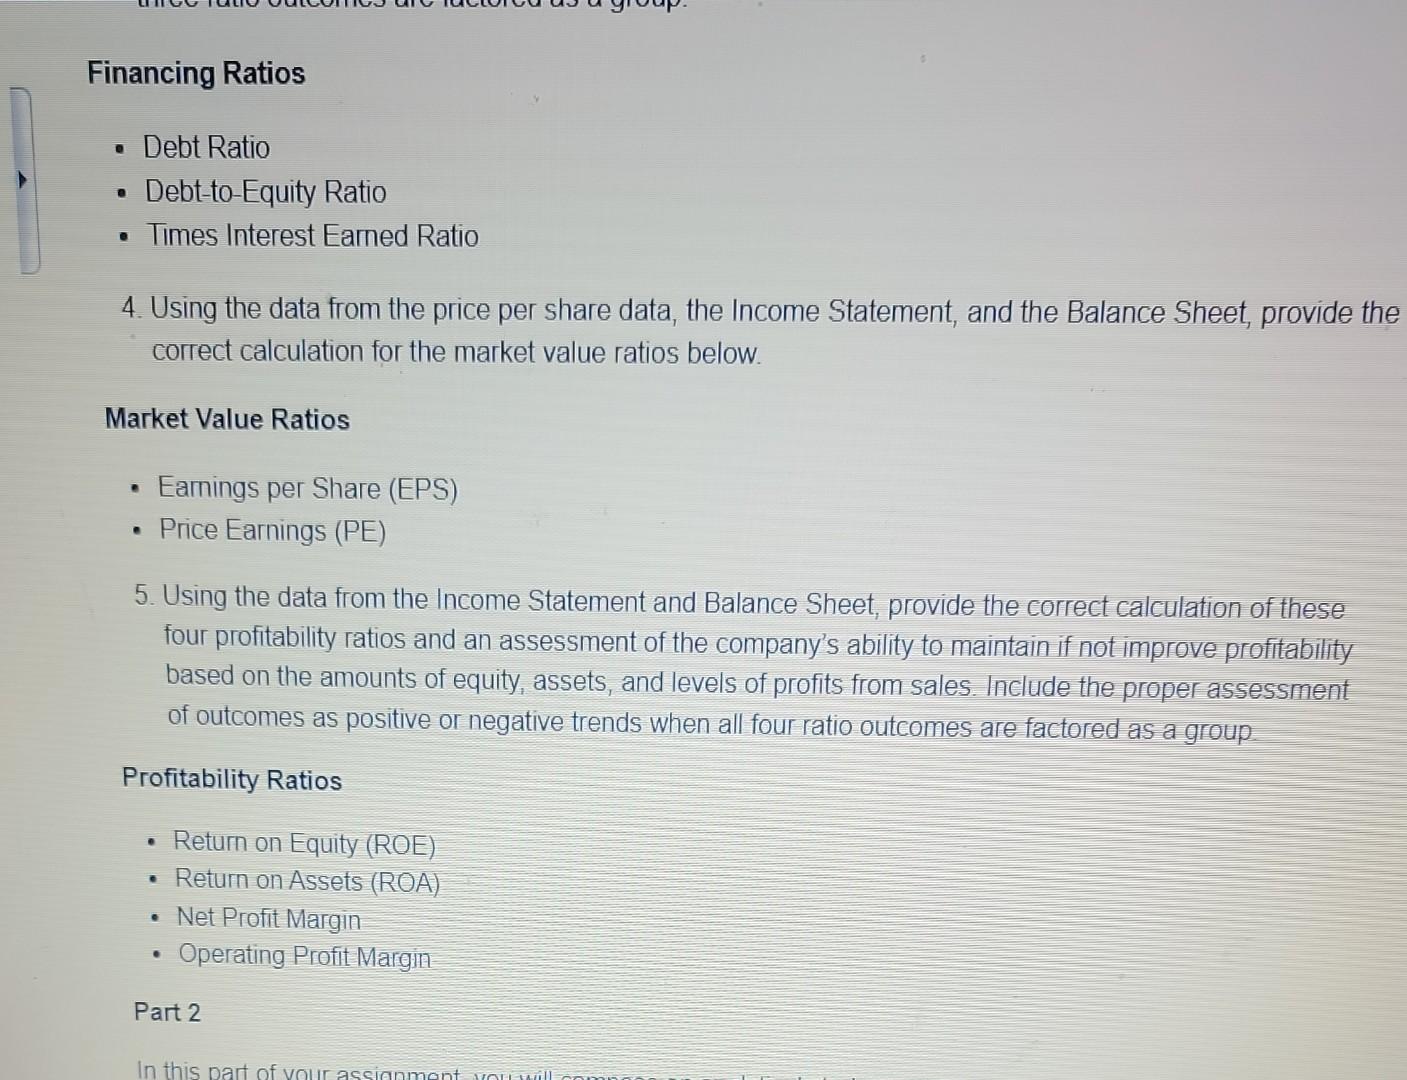
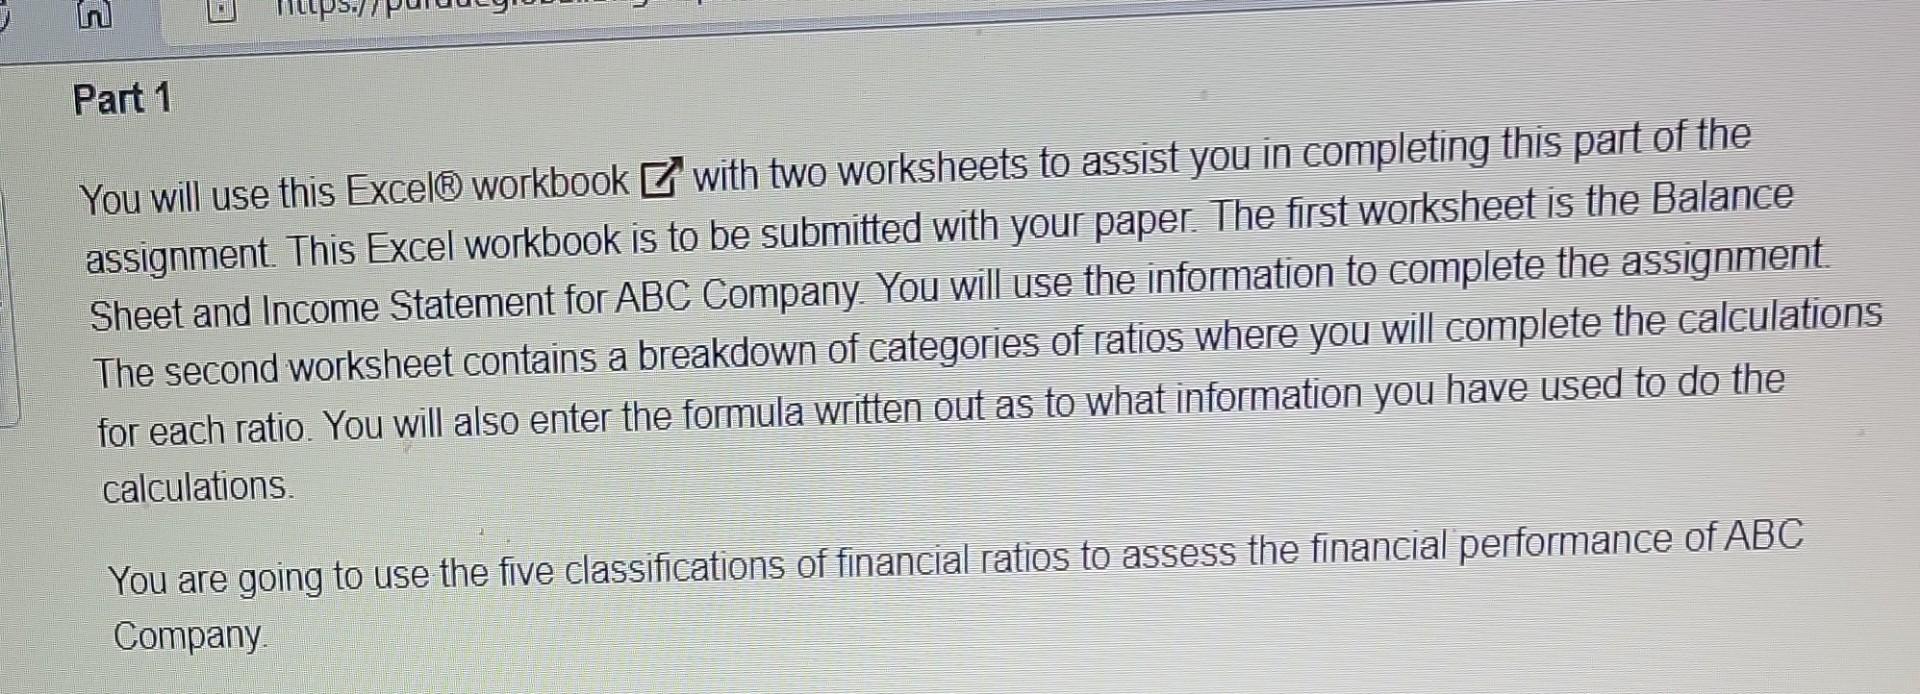
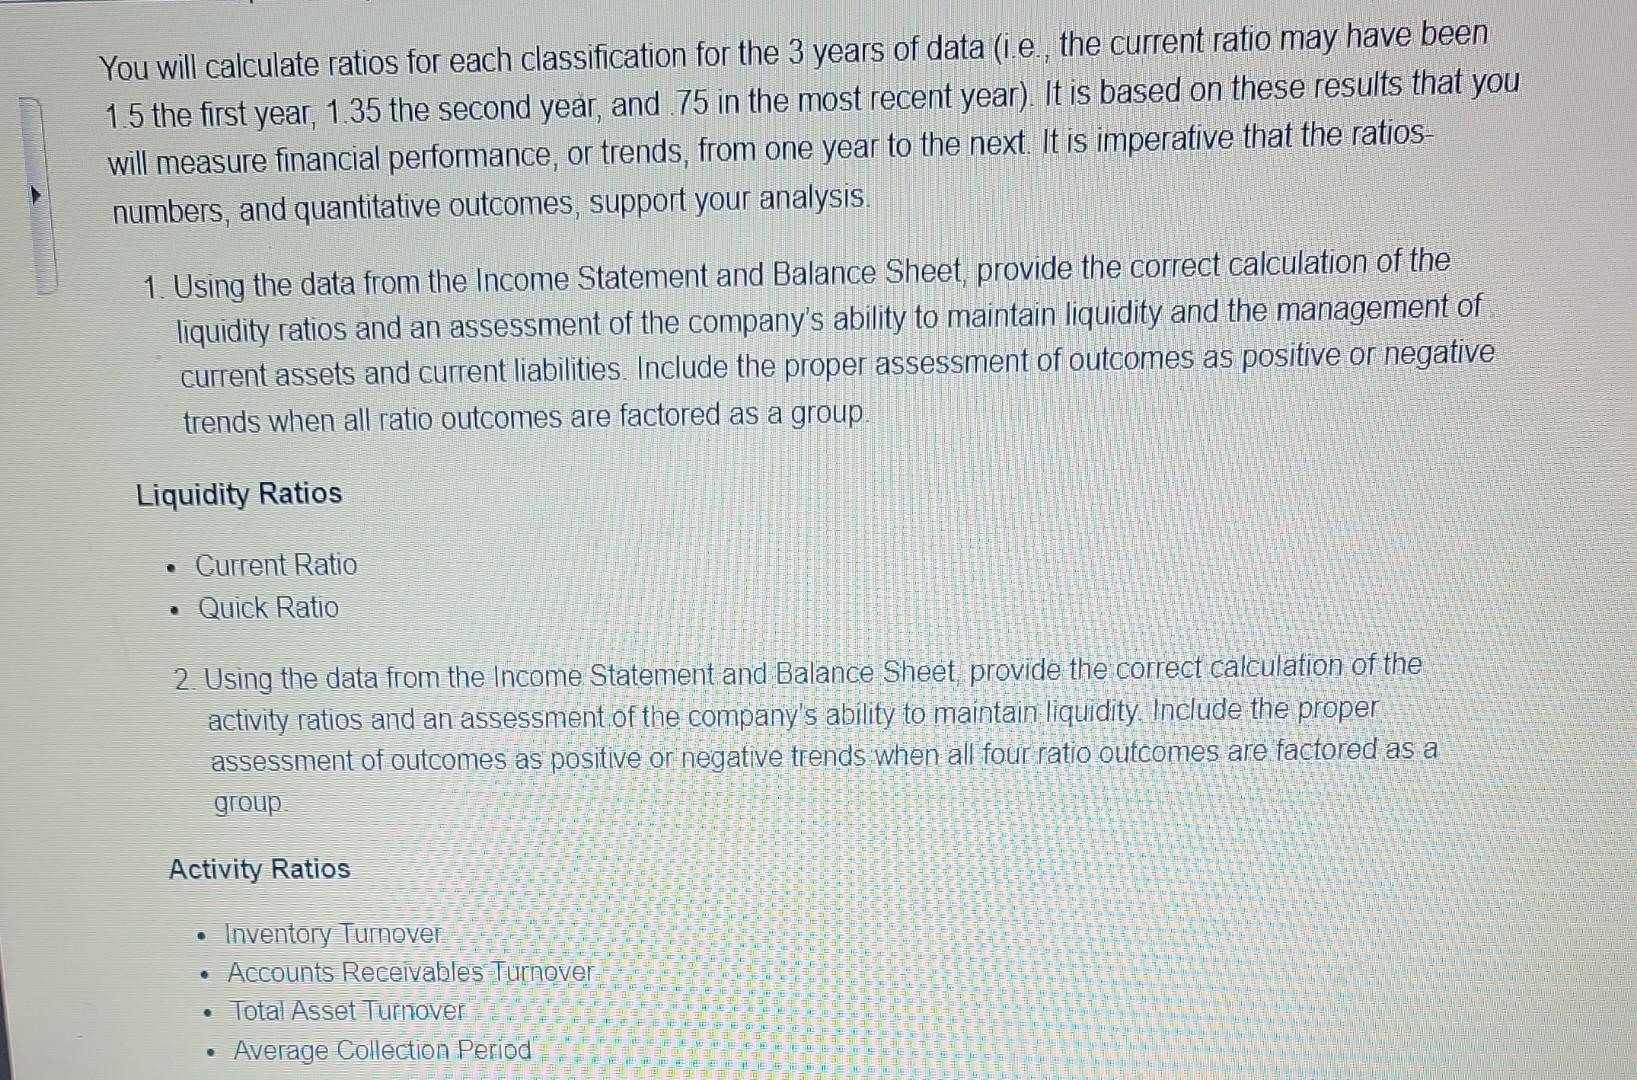
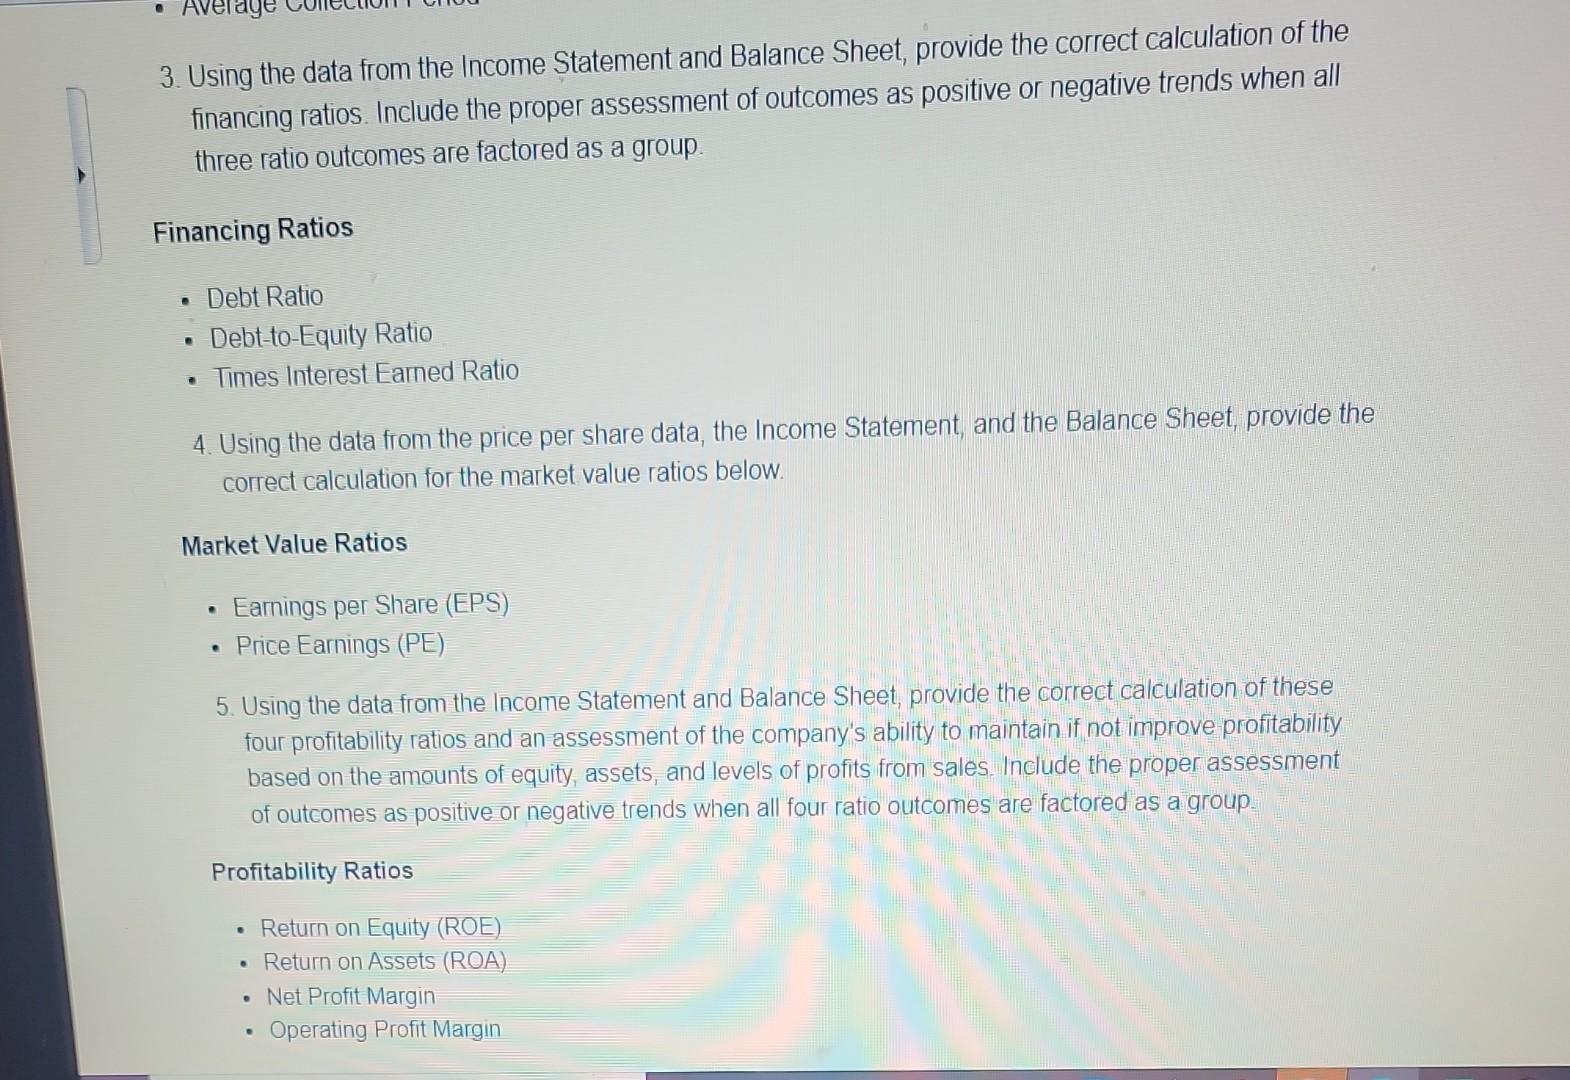
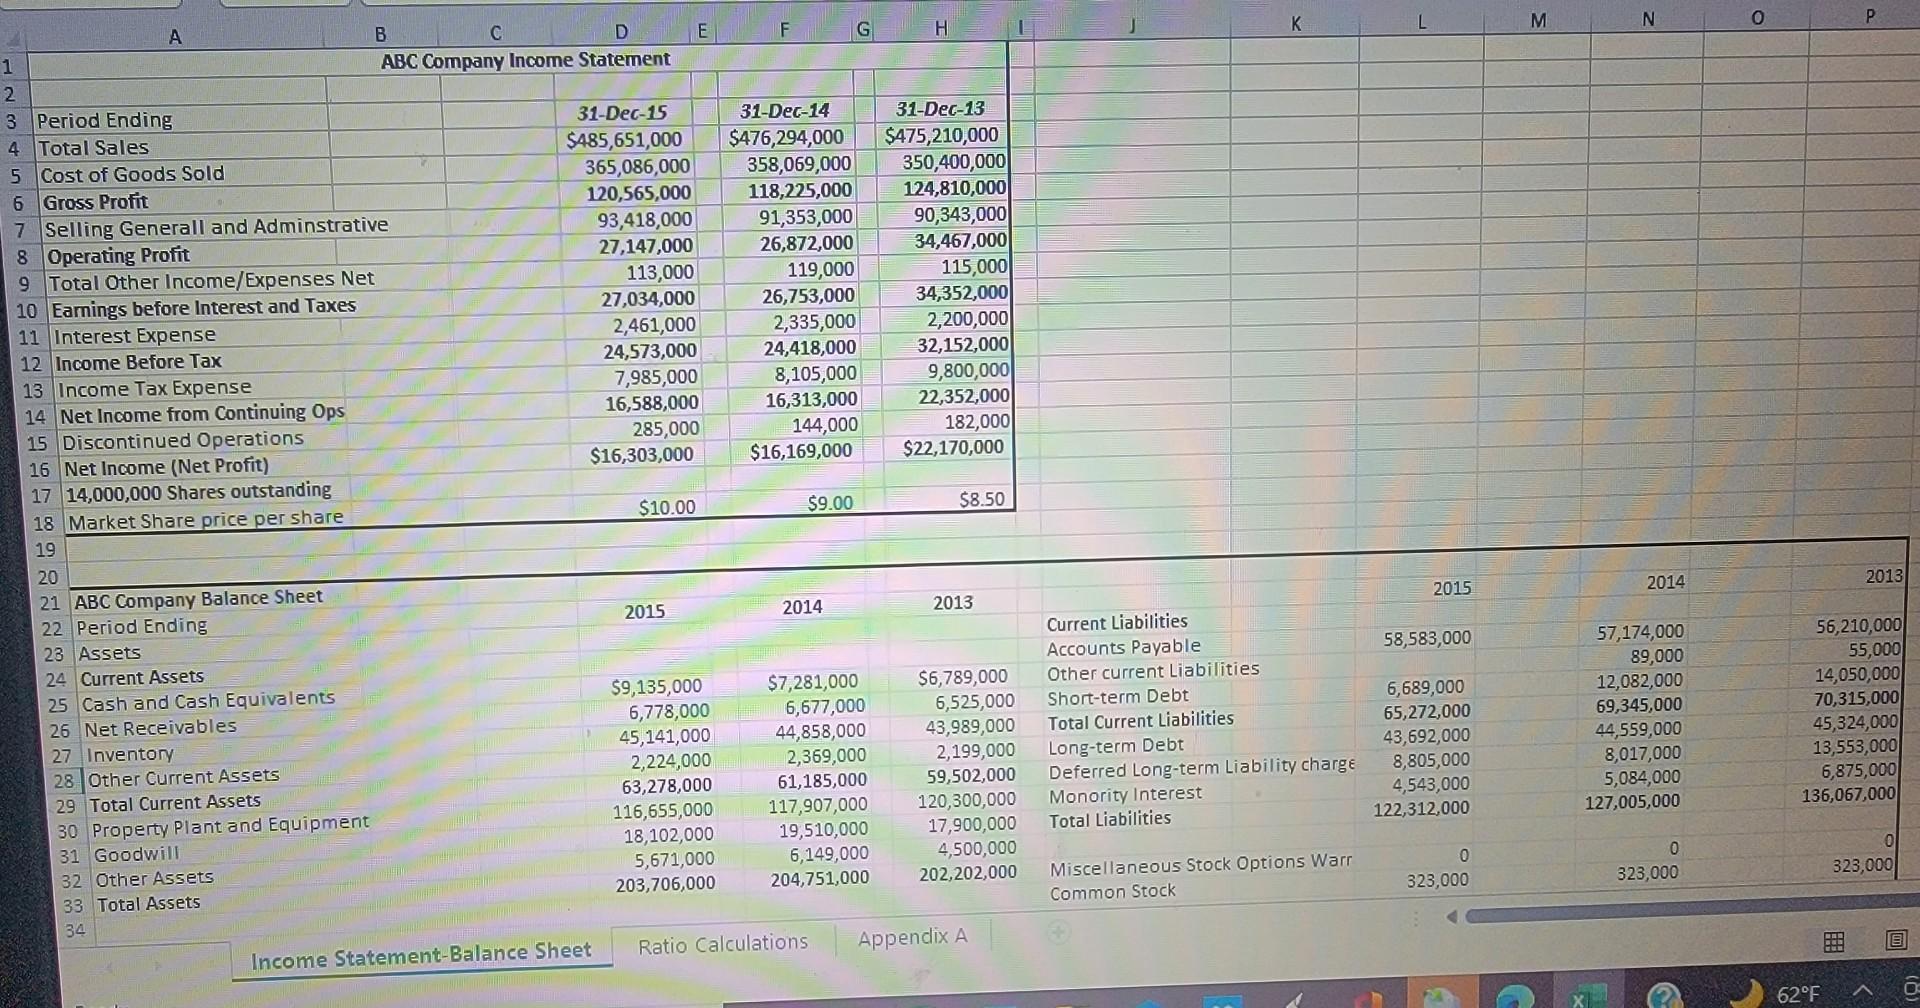
Market Value Ratios - Earnings per Share (EPS) - Price Earnings (PE) 5. Using the data from the Income Statement and Balance Sheet, provide the correct calculation of these four profitability ratios and an assessment of the company's ability to maintain if not improve profitability based on the amounts of equity, assets, and levels of profits from sales. Include the proper assessment of outcomes as positive or negative trends when all four ratio outcomes are factored as a group. 1.5 the first year, 1.35 the second year, and .75 in the most recent year). It is based on these results that you will measure financial performance, or trends, from one year to the next. It is imperative that the ratiosnumbers, and quantitative outcomes, support your analysis. 1 Using the data from the Income Statement and Balance Sheet, provide the correct calculation of the liquidity ratios and an assessment of the company's ability to maintain liquidity and the management of current assets and current liabilities. Include the proper assessment of outcomes as positive or negative trends when all ratio outcomes are factored as a group. Liquidity Ratios - Current Ratio - Quick Ratio 2. Using the data from the Income Statement and Balance Sheet, provide the correct calculation of the activity ratios and an assessment of the companys s ability to maintain liquidity Include the proper assessment of outcomes as positive or negative trends when all four ratio outcomes are facfored as a group Activity Ratios - Inventory Turnover - Accounts Receivables turnover - TotailAsset Turnover - Average-Coollection peliod 3 Using the daata formthe inconie statement and Balance. Shed provide the correct calculation of the financing -atios: ncilud theiproper assessmient of outc omes as positive or thegative trends when all three atiooutcomes are factoled as a 'grounp Financing Ratios - Debt Ratio - Debt-to-Equity Ratio - Times Interest Earned Ratio 4. Using the data from the price per share data, the Income Statement, and the Balance Sheet, provide the correct calculation for the market value ratios below. Market Value Ratios - Earnings per Share (EPS) - Price Earnings (PE) 5. Using the data from the Income Statement and Balance Sheet, provide the correct calculation of these four profitability ratios and an assessment of the company's ability to maintain if not improve profitability based on the amounts of equity, assets, and levels of profits from sales. Include the proper assessment of outcomes as positive or negative trends when all four ratio outcomes are factored as a group Profitability Ratios - Return on Equity (ROE) - Return on Assets (ROA) - Net Profit Margin - Operating Profit Margin- Part 2 Part 1 You will use this Excel workbook with two worksheets to assist you in completing this part of the assignment. This Excel workbook is to be submitted with your paper. The first worksheet is the Balance Sheet and Income Statement for ABC Company. You will use the information to complete the assignment. The second worksheet contains a breakdown of categories of ratios where you will complete the calculations for each ratio. You will also enter the formula written out as to what information you have used to do the calculations. You are going to use the five classifications of financial ratios to assess the financial performance of ABC Company. You will calculate ratios for each classification for the 3 years of data (i.e., the current ratio may have been 1.5 the first year, 1.35 the second year, and 75 in the most recent year). It is based on these results that you will measure financial performance, or trends, from one year to the next. It is imperative that the ratiosnumbers, and quantitative outcomes, support your analysis. 1. Using the data from the Income Statement and Balance Sheet, provide the correct calculation of the liquidity ratios and an assessment of the company's ability to maintain liquidity and the management of current assets and current liabilities. Include the proper assessment of outcomes as positive or negative trends when all ratio outcomes are factored as a group. Liquidity Ratios - Current Ratio - Quick Ratio 2. Using the data from the Income Statement and Balance Sheet, provide the correct calculation of the activity ratios and an assessment of the company's ability to maintain liquidity. Include the proper assessment of outcomes as positive or negative trends when all four ratio outcomes are factored as a group. Activity Ratios - Inventory Turnover - Accounts Receivables Turnover - Total Asset Turnover - Average Collection Period 3. Using the data from the Income Statement and Balance Sheet, provide the correct calculation of the financing ratios. Include the proper assessment of outcomes as positive or negative trends when all three ratio outcomes are factored as a group. Financing Ratios - Debt Ratio - Debt-to-Equity Ratio - Times Interest Earmed Ratio 4. Using the data from the price per share data, the Income Statement, and the Balance Sheet, provide the correct calculation for the market value ratios below. Market Value Ratios - Earnings per Share (EPS) - Price Earnings (PE) 5. Using the data from the Income Statement and Balance Sheet, provide the correct calculation of these four profitability ratios and an assessment of the company's ability to maintain if not improve profitability based on the amounts of equity, assets, and levels of profits from sales. Include the proper assessment of outcomes as positive or negative trends when all four ratio outcomes are factored as a group. Profitability Ratios - Return on Equity (ROE) - Return on Assets (ROA) - Net Profit Margin
Step by Step Solution
There are 3 Steps involved in it

Get step-by-step solutions from verified subject matter experts