

Question: please provide for liquidity ratios 1. Using the data from the Income Statement and Balance Sheet, provide the correct calculation of the liquidity ratios and
please provide for liquidity ratios
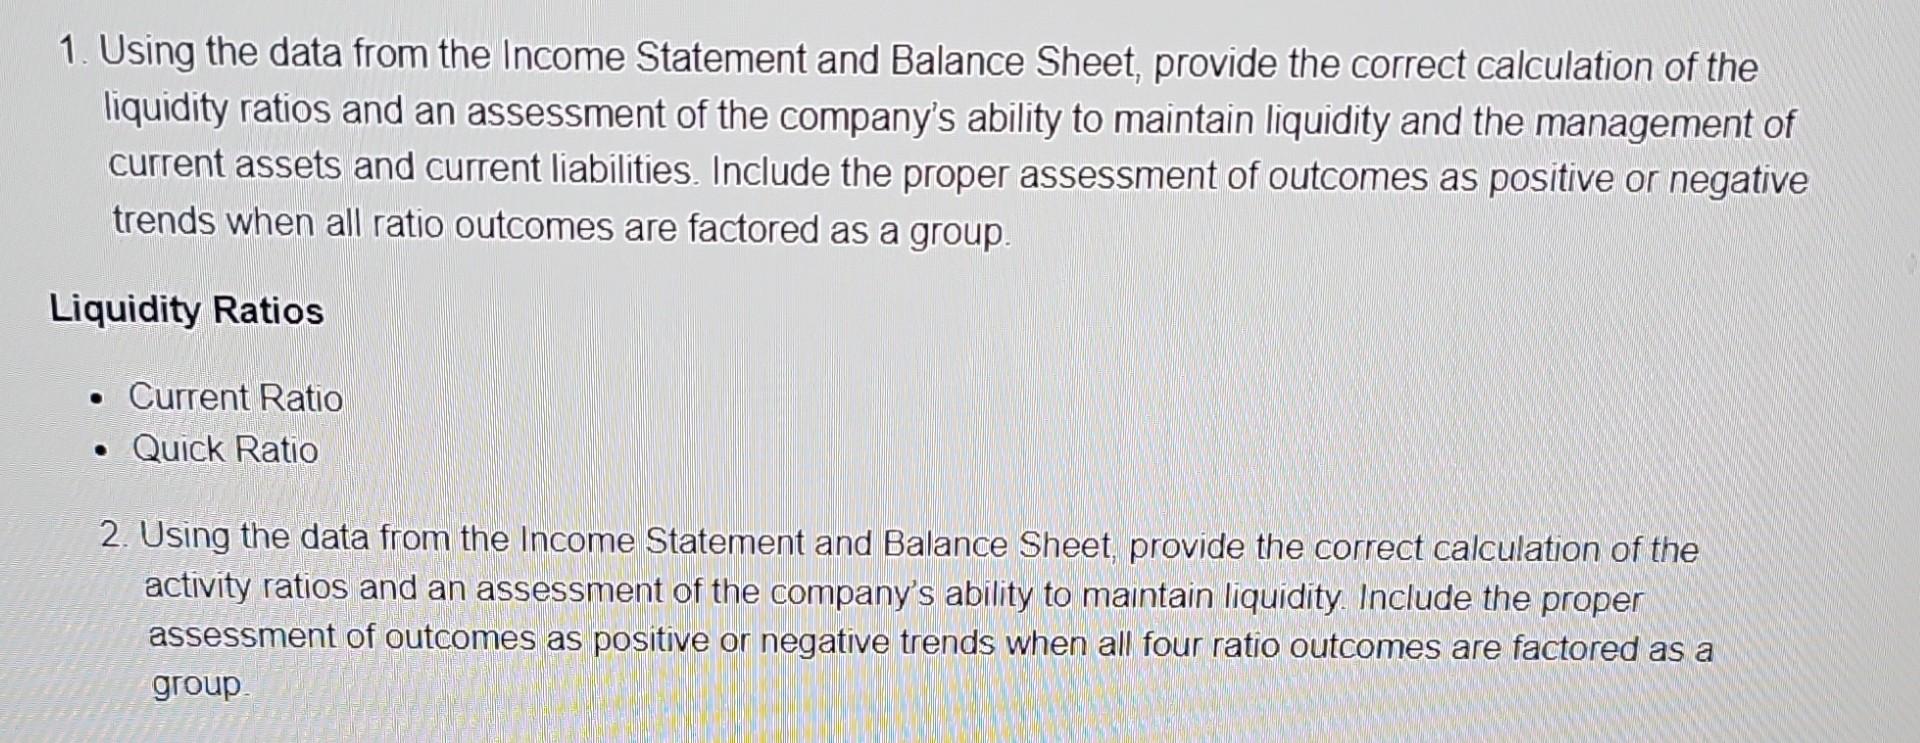
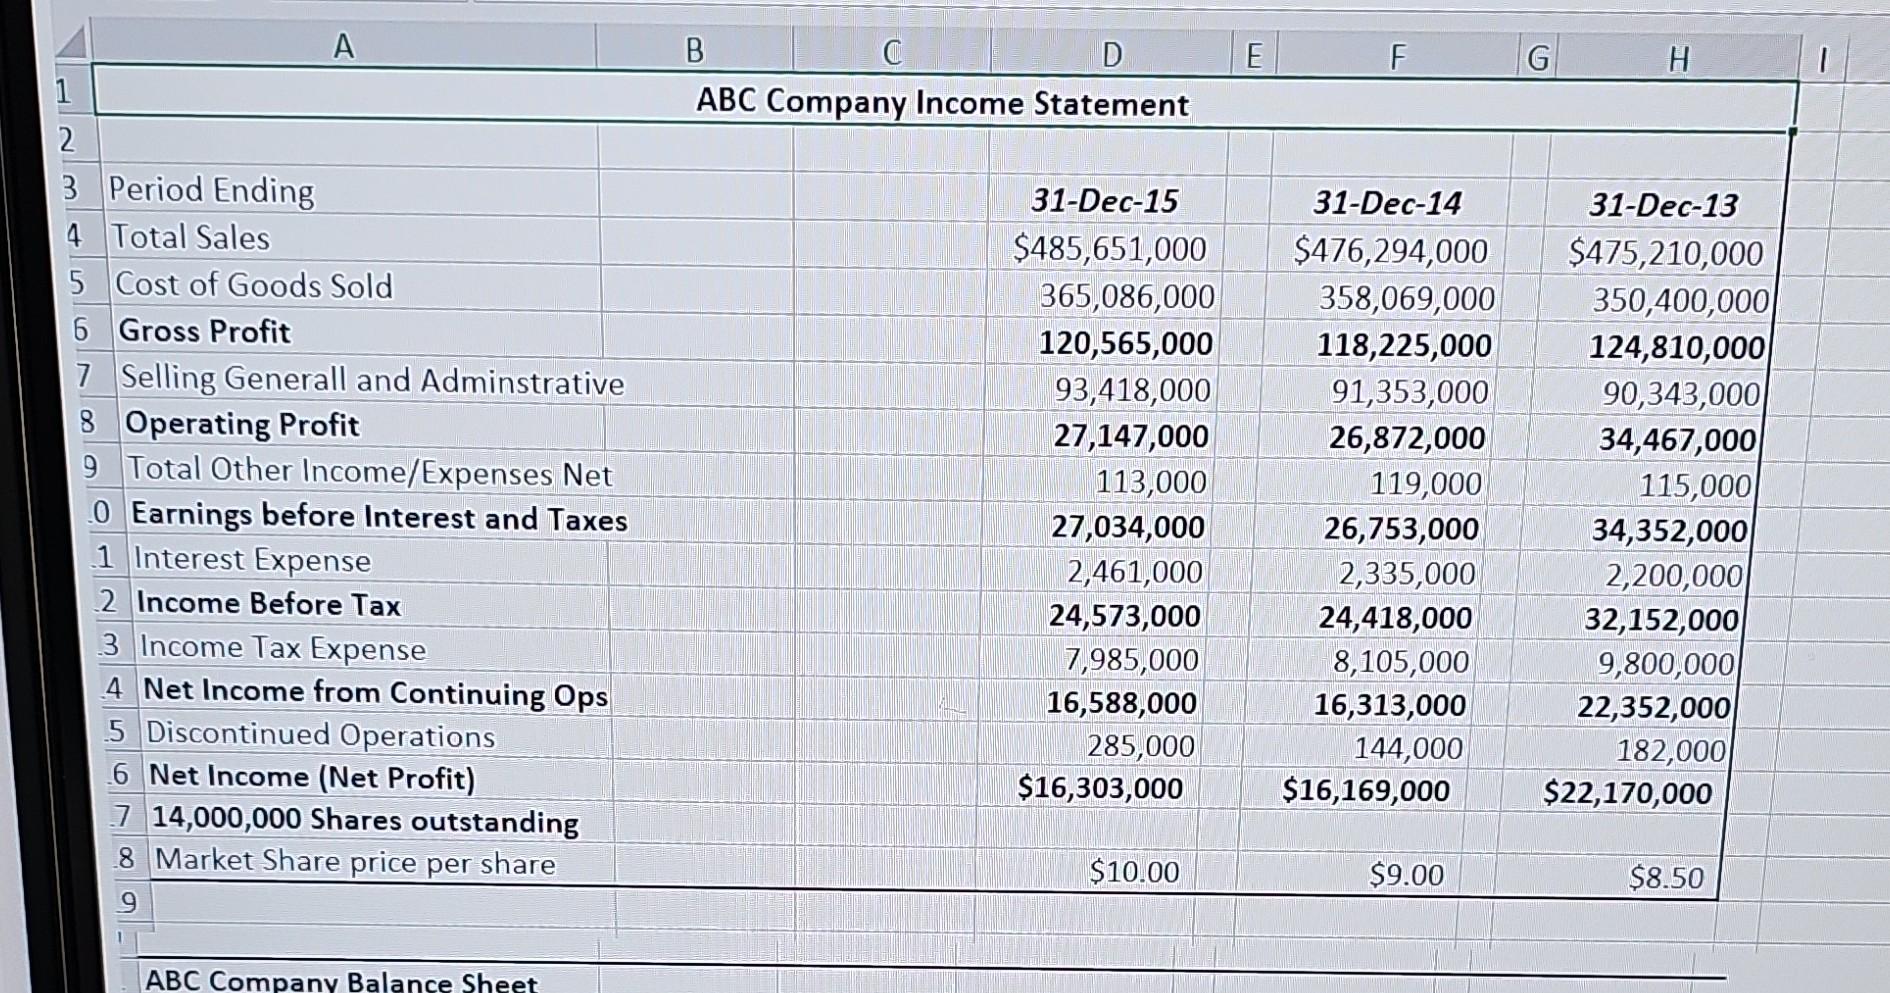
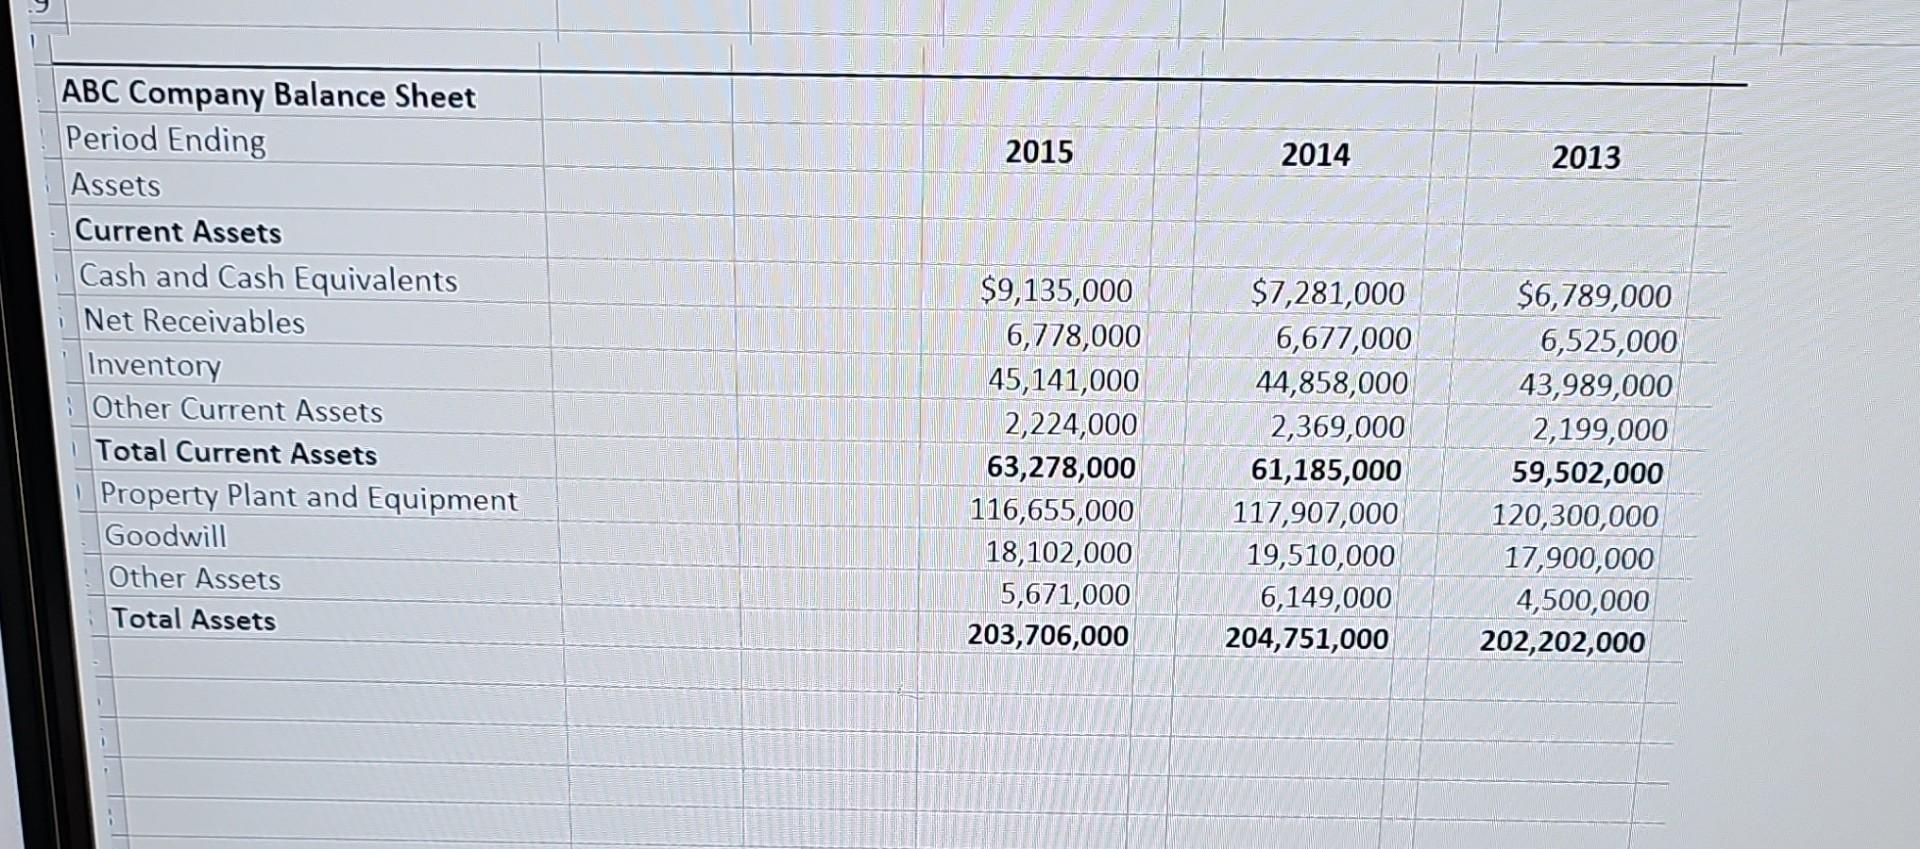
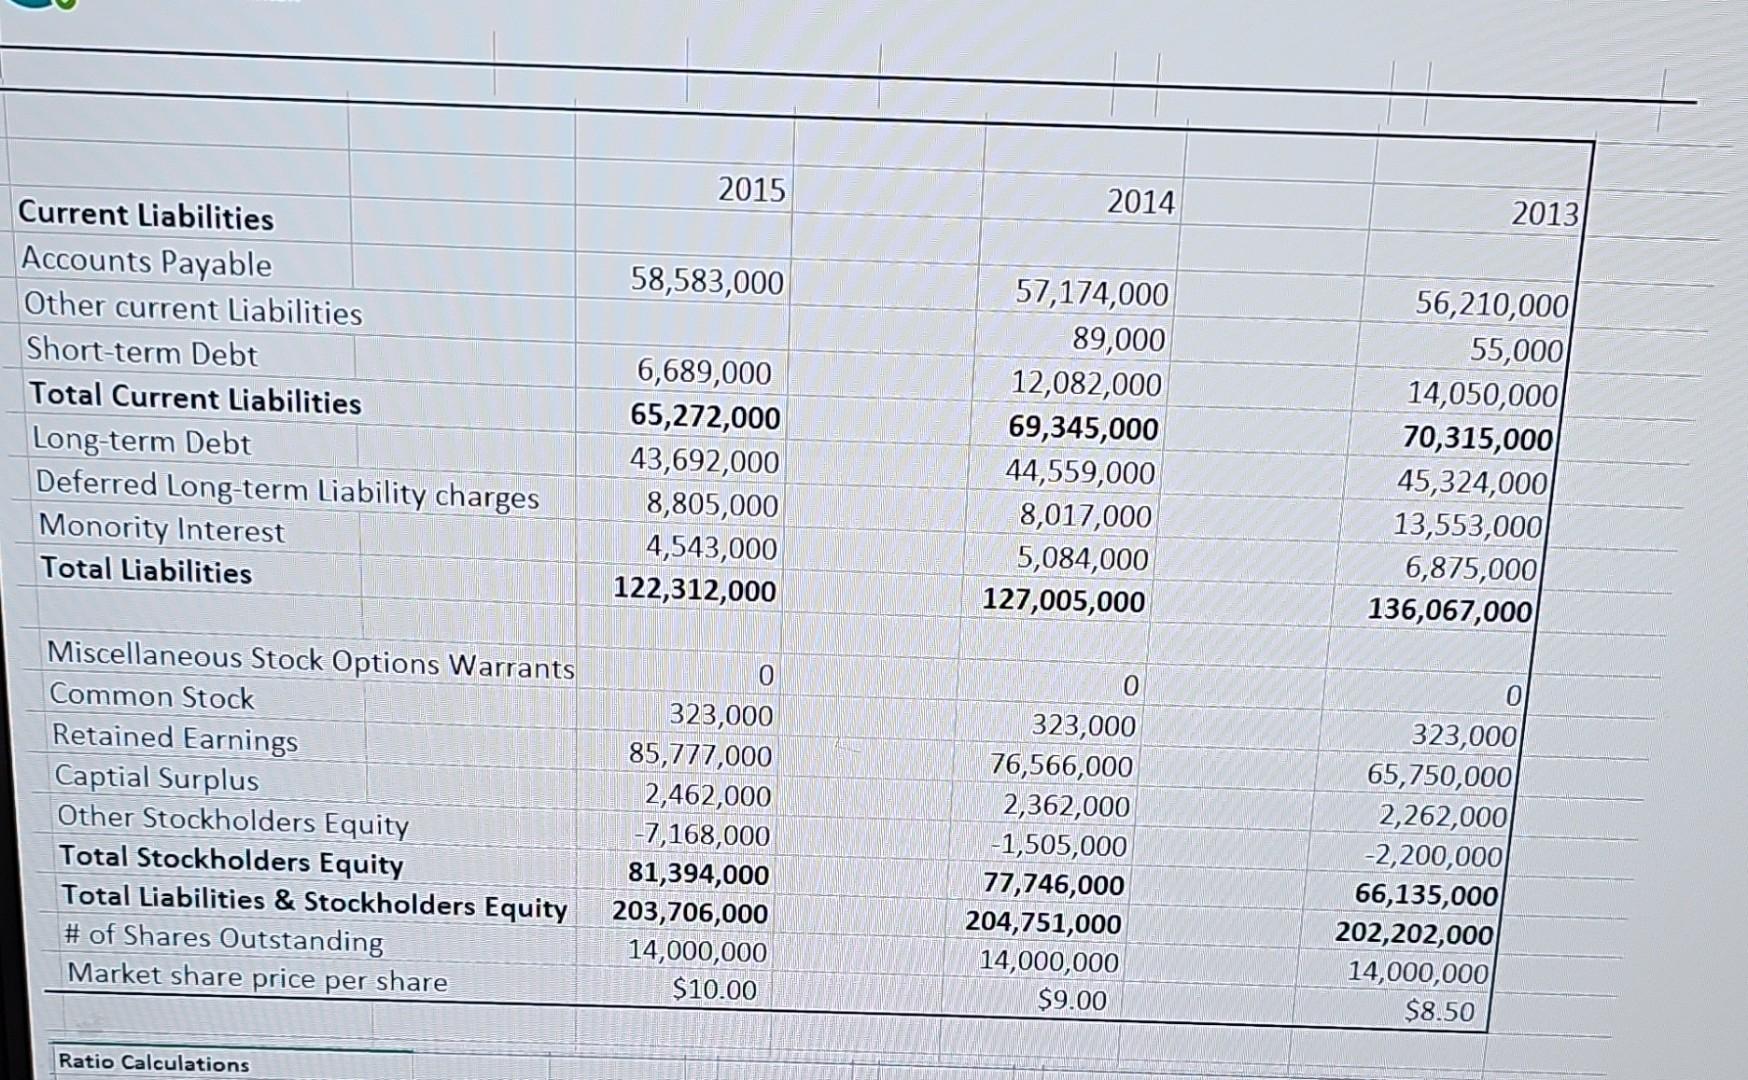
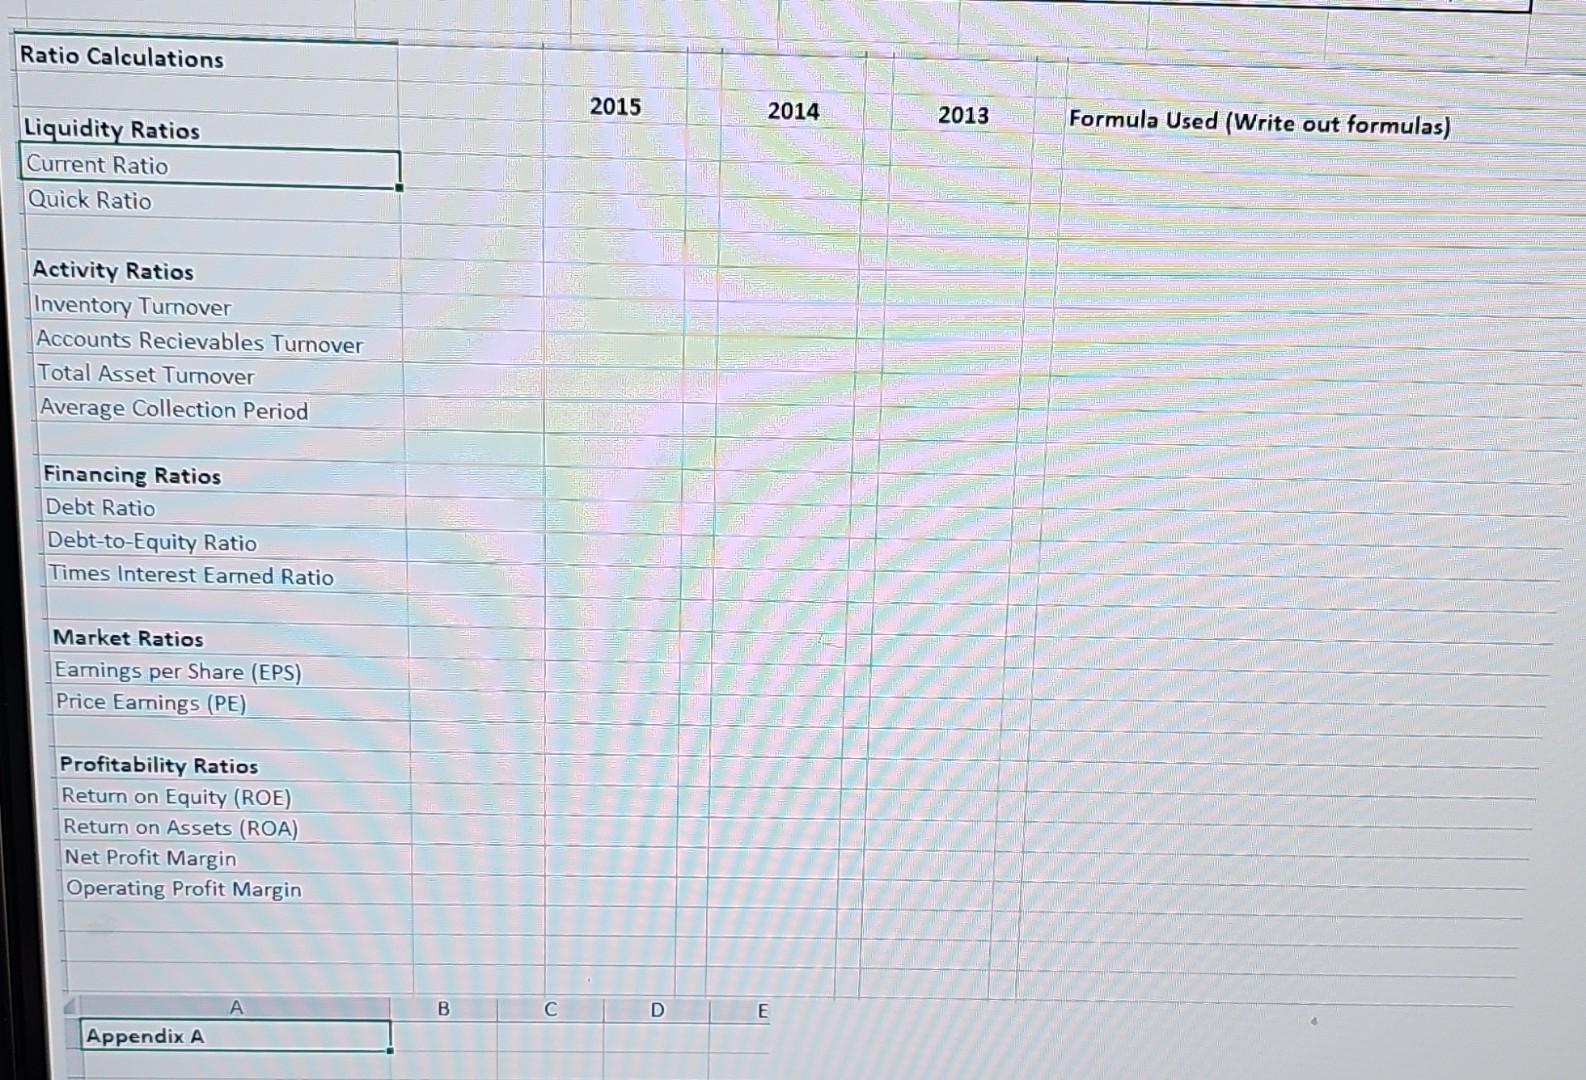
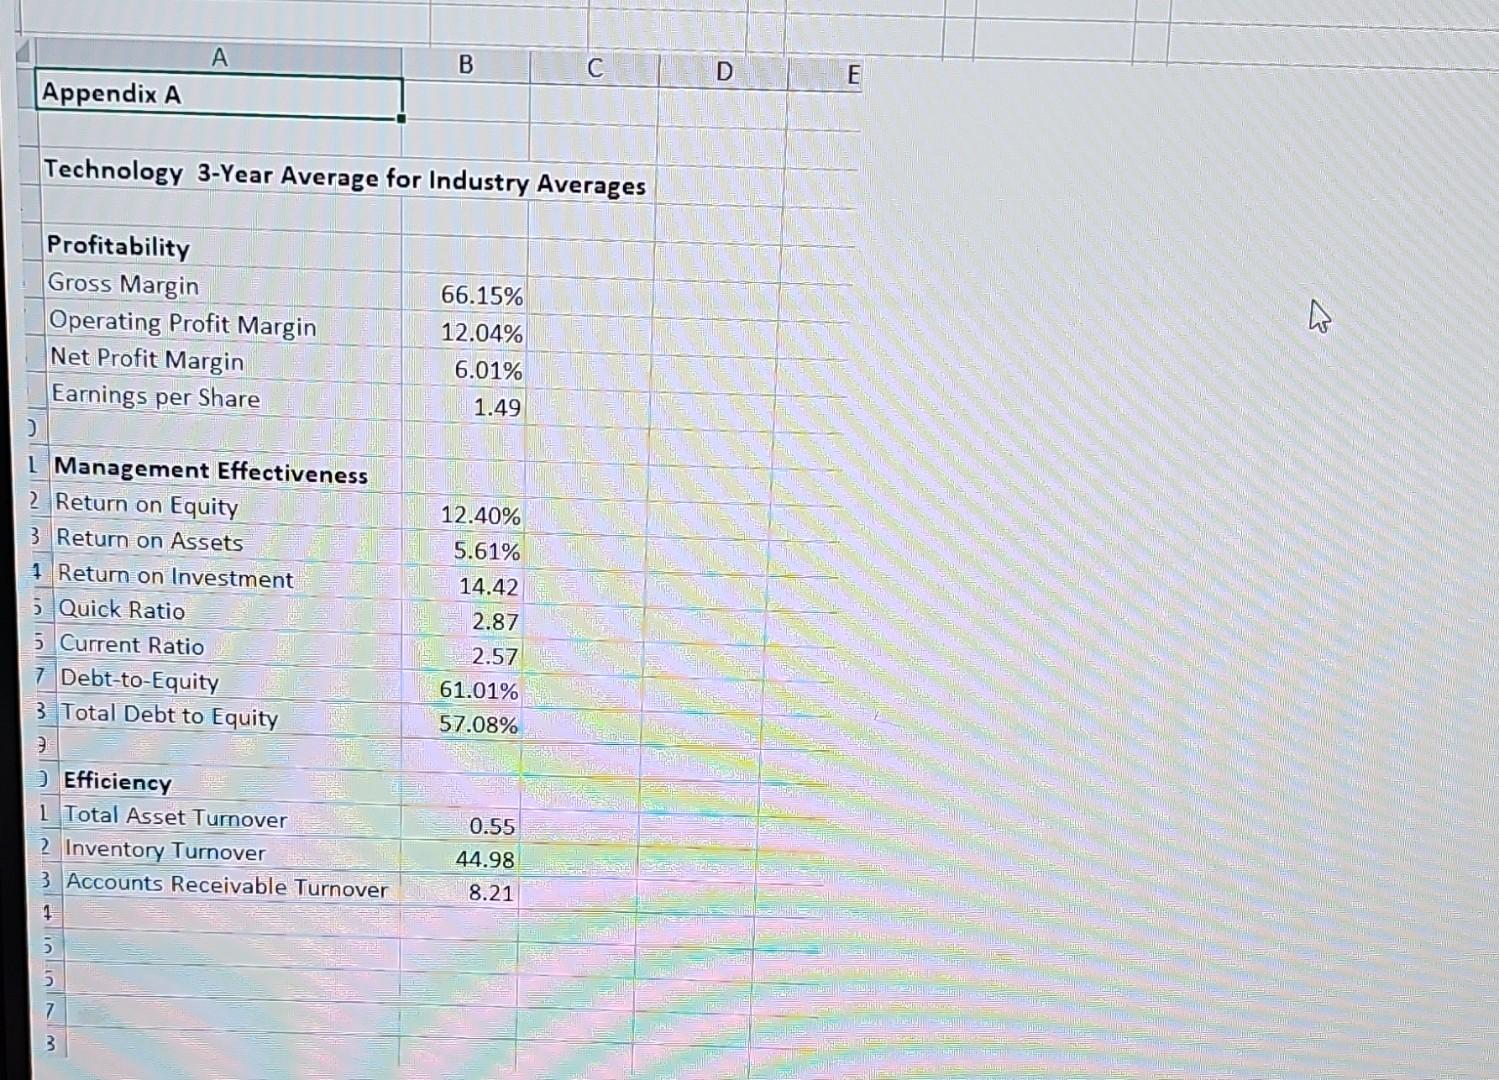
1. Using the data from the Income Statement and Balance Sheet, provide the correct calculation of the liquidity ratios and an assessment of the company's ability to maintain liquidity and the management of current assets and current liabilities. Include the proper assessment of outcomes as positive or negative trends when all ratio outcomes are factored as a group. Liquidity Ratios - Current Ratio - Quick Ratio 2. Using the data from the Income Statement and Balance Sheet, provide the correct calculation of the activity ratios and an assessment of the company's ability to maintain liquidity. Include the proper assessment of outcomes as positive or negative trends when all four ratio outcomes are factored as a group \begin{tabular}{|l|r|r|r|} \hline ABC Company Balance Sheet & & & \\ \hline Period Ending & 2015 & 2014 & \multicolumn{1}{|c|}{2013} \\ \hline Assets & & & \\ \hline Current Assets & & & \\ \hline Cash and Cash Equivalents & $9,135,000 & $7,281,000 & $6,789,000 \\ \hline Net Receivables & 6,778,000 & 6,677,000 & 6,525,000 \\ \hline Inventory & 45,141,000 & 44,858,000 & 43,989,000 \\ \hline Other Current Assets & 2,224,000 & 2,369,000 & 2,199,000 \\ \hline Total Current Assets & 63,278,000 & 61,185,000 & 59,502,000 \\ \hline Property Plant and Equipment & 116,655,000 & 117,907,000 & 120,300,000 \\ \hline Goodwill & 18,102,000 & 19,510,000 & 17,900,000 \\ \hline Other Assets & 5,671,000 & 6,149,000 & 4,500,000 \\ \hline Total Assets & 203,706,000 & 204,751,000 & 202,202,000 \\ \hline \end{tabular} Ratio Calculations Ratio Calculations Liquidity Ratios 2015 2014 2013 Formula Used (Write out formulas) Activity Ratios Inventory Turnover Accounts Recievables Turnover Total Asset Turnover Average Collection Period Financing Ratios Debt Ratio Debt-to-Equity Ratio Times Interest Earned Ratio Market Ratios Earnings per Share (EPS) Price Earnings (PE) Profitability Ratios Return on Equity (ROE) Return on Assets (ROA) Net Profit Margin Operating Profit Margin Appendix A \begin{tabular}{l|l} B & C \end{tabular} D E Technology 3-Year Average for Industry Averages
Step by Step Solution
There are 3 Steps involved in it

Get step-by-step solutions from verified subject matter experts