

Question: I need help with my excel assignment. So the assignment is for me to use the solver tool in excel and it will automatically populate
I need help with my excel assignment.
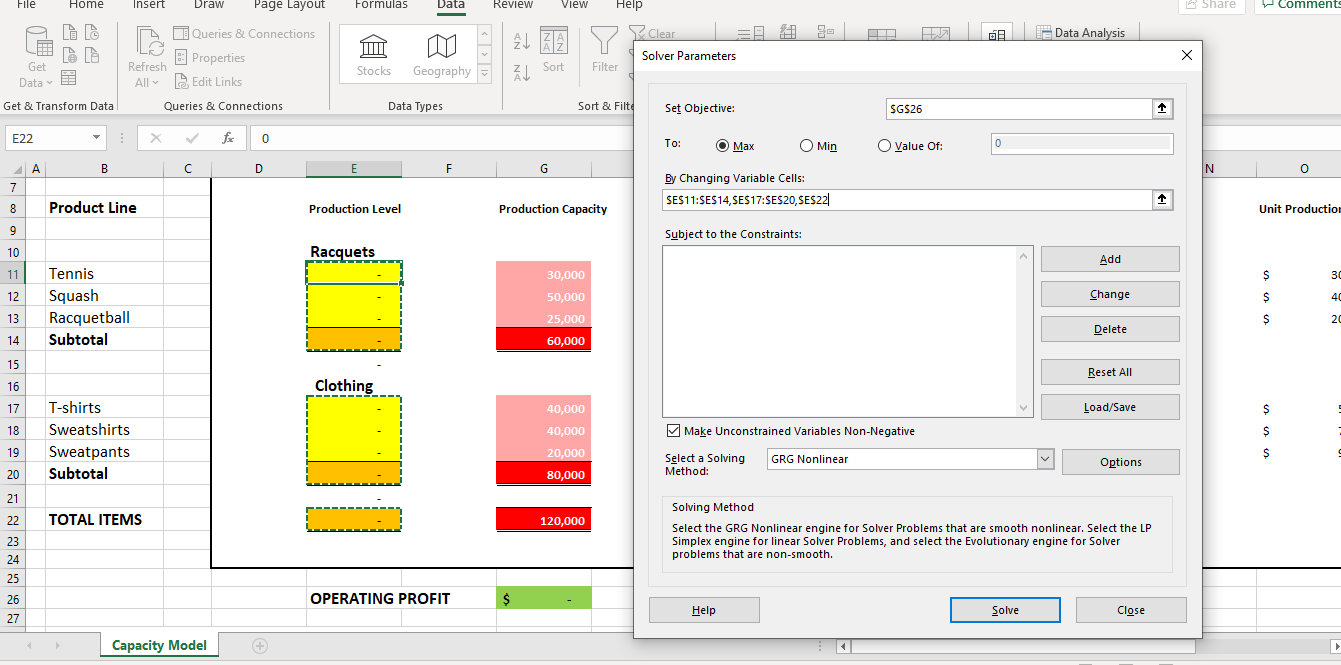
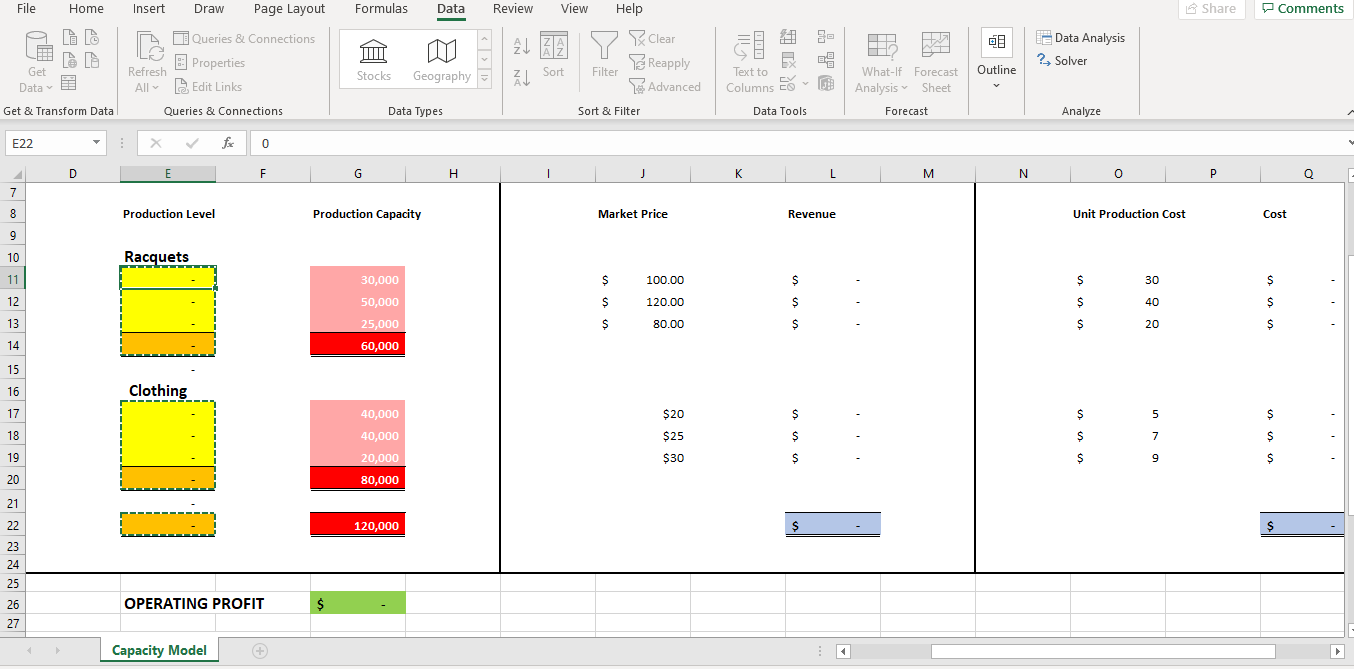
So the assignment is for me to use the solver tool in excel and it will automatically populate the yellow and orange cells, which in turn will populate the other cells.
This assignment is about the production of 2 items. I want to find the right combination that will produce the maximum profit. The red cells show the maximum amount of each product I can produce.
Production capacity for Racquets shows the maximum amount that can be produced, and 60,000 is the maximum total.
The same goes for clothing for its numbers.
The total number of items need to equal 120,000. (keep in mind that 60,000+80,000=140,000)
I would like the subject constraint.
Solver parameter is on the right of the first picture.
I am not sure if the variable cell is correct, so please look over it for me.
Thank you in advance!!
File Home Insert Share Comments Draw Page Layout Queries & Connections Formulas Data Review View Help 1 ALZA Y Clear 3 Solver Parameters Stocks Geography = 2 Filter 3 A Data Analysis Refresh Properties Get Data Get & Transform Data All Edit Links Queries & Connections Data Types a Sort & Filte sort Set Objective: SG$26 E22 X fico To: O Max Min O Value of: A B C D E F G By Changing Variable Cells: SE$11:$E$14, SE$17:$E$20, $E$22|| Product Line Production Level Production Capacity Unit Production 8 9 Subject to the Constraints: Racquets Add Change Tennis Squash Racquetball Subtotal 30,000 50,000 25,000 60,000 Delete 14 Reset All Clothing Load/Save 40,000 40,000 Make Unconstrained Variables Non-Negative T-shirts Sweatshirts Sweatpants Subtotal 20,000 Select a Solving Method: GRG Nonlinear Options 80,000 TOTAL ITEMS 120,000 Solving Method Select the GRG Nonlinear engine for Solver Problems that are smooth nonlinear. Select the LP Simplex engine for linear Solver Problems, and select the Evolutionary engine for Solver problems that are non-smooth. OPERATING PROFIT $ . Help Solve Close Capacity Model File Home Formulas Data Review View Help Share Comments Insert s 0 Draw Page Layout Queries & Connections 21 T Y III 3 clear E Data Analysis ? Solver LE Te Reapply Refresh Properties Stocks Geography = Filter Outline Get Data Get & Transform Data All Advanced Edit Links Queries & Connections Text to Columns E- Data Tools What If Forecast Analysis Sheet Forecast Data Types Sort & Filter Analyze E22 - V x x E 0 F G H I J K L M N O P Q Production Level Production Capacity Market Price Revenue Unit Production Cost Racquets 30,000 50,000 25,000 60,000 100.00 120.00 80.00 $ Clothing 40,000 40,000 20,000 80,000 120,000 OPERATING PROFIT Capacity Model File Home Insert Share Comments Draw Page Layout Queries & Connections Formulas Data Review View Help 1 ALZA Y Clear 3 Solver Parameters Stocks Geography = 2 Filter 3 A Data Analysis Refresh Properties Get Data Get & Transform Data All Edit Links Queries & Connections Data Types a Sort & Filte sort Set Objective: SG$26 E22 X fico To: O Max Min O Value of: A B C D E F G By Changing Variable Cells: SE$11:$E$14, SE$17:$E$20, $E$22|| Product Line Production Level Production Capacity Unit Production 8 9 Subject to the Constraints: Racquets Add Change Tennis Squash Racquetball Subtotal 30,000 50,000 25,000 60,000 Delete 14 Reset All Clothing Load/Save 40,000 40,000 Make Unconstrained Variables Non-Negative T-shirts Sweatshirts Sweatpants Subtotal 20,000 Select a Solving Method: GRG Nonlinear Options 80,000 TOTAL ITEMS 120,000 Solving Method Select the GRG Nonlinear engine for Solver Problems that are smooth nonlinear. Select the LP Simplex engine for linear Solver Problems, and select the Evolutionary engine for Solver problems that are non-smooth. OPERATING PROFIT $ . Help Solve Close Capacity Model File Home Formulas Data Review View Help Share Comments Insert s 0 Draw Page Layout Queries & Connections 21 T Y III 3 clear E Data Analysis ? Solver LE Te Reapply Refresh Properties Stocks Geography = Filter Outline Get Data Get & Transform Data All Advanced Edit Links Queries & Connections Text to Columns E- Data Tools What If Forecast Analysis Sheet Forecast Data Types Sort & Filter Analyze E22 - V x x E 0 F G H I J K L M N O P Q Production Level Production Capacity Market Price Revenue Unit Production Cost Racquets 30,000 50,000 25,000 60,000 100.00 120.00 80.00 $ Clothing 40,000 40,000 20,000 80,000 120,000 OPERATING PROFIT Capacity Model
Step by Step Solution
There are 3 Steps involved in it

Get step-by-step solutions from verified subject matter experts