

Question: I need help with problem B. thank you Homework: 6-2 MyStatLab: Module Six Problem Set Save Score: 0 of 5 pts 13 of 14 (10
I need help with problem B. thank you
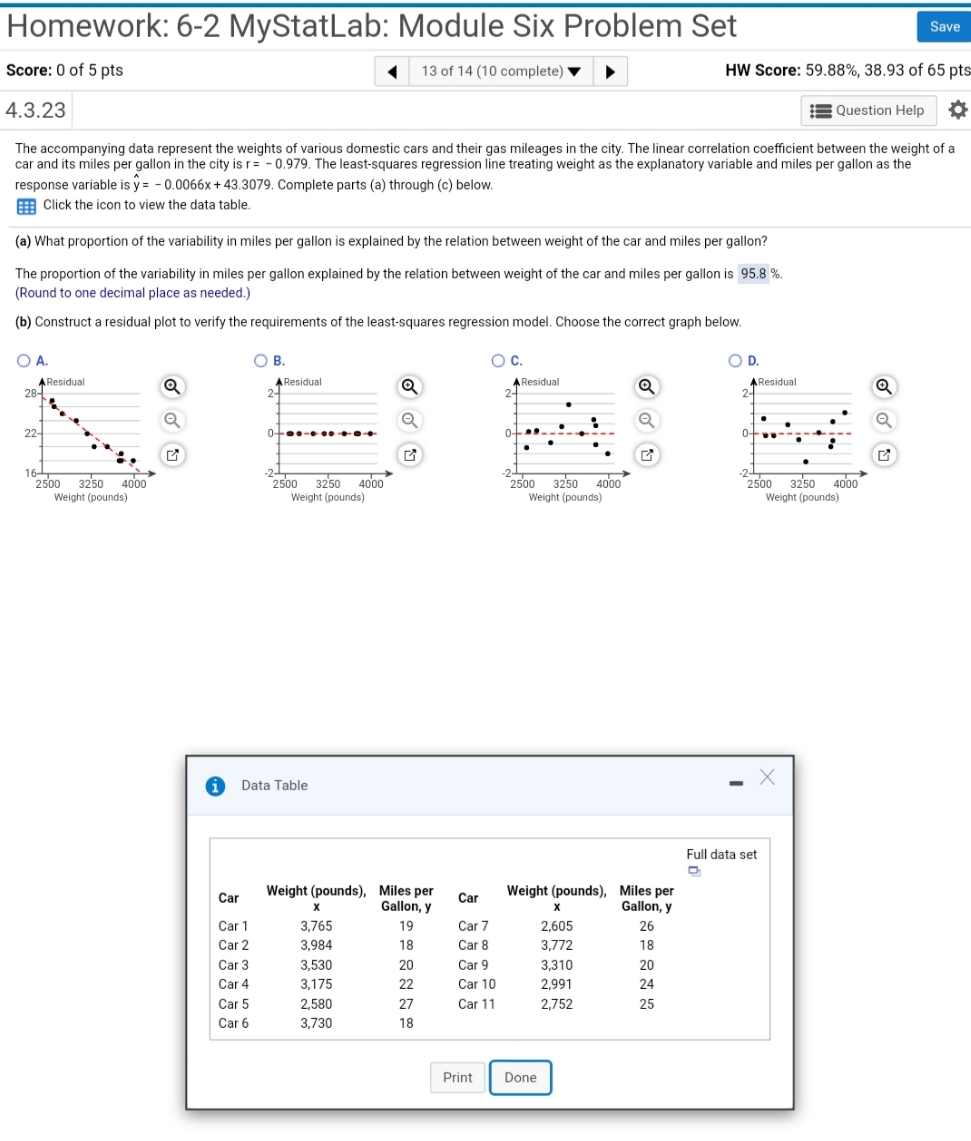
Homework: 6-2 MyStatLab: Module Six Problem Set Save Score: 0 of 5 pts 13 of 14 (10 complete) HW Score: 59.88%, 38.93 of 65 pt 4.3.23 Question Help The accompanying data represent the weights of various domestic cars and their gas mileages in the city. The linear correlation coefficient between the weight of a car and its miles per gallon in the city is r= - 0.979. The least-squares regression line treating weight as the explanatory variable and miles per gallon as the response variable is y= - 0.0066x + 43.3079. Complete parts (a) through (c) below. Click the icon to view the data table. (a) What proportion of the variability in miles per gallon is explained by the relation between weight of the car and miles per gallon? The proportion of the variability in miles per gallon explained by the relation between weight of the car and miles per gallon is 95.8 %. (Round to one decimal place as needed.) (b) Construct a residual plot to verify the requirements of the least-squares regression model. Choose the correct graph below. O A. O B. O C. OD. AResidual A Residual * Residual 28- 2- 2- Q AResidual 2-1 22- 16-T 2500 4000 2-T 2500 3250 4000 2500 3250 4000 2-T 2500 3250 4000 Weight (pounds) Weight (pounds) Weight (pounds) Weight (pounds) i Data Table - X Full data set Car Weight (pounds), Miles per Car Weight (pounds), Miles per Gallon, y X Gallon, y Car 1 3,765 19 Car 7 2,605 26 Car 2 3,984 18 Car 8 3,772 18 Car 3 3,530 20 Car 9 3,310 20 Car 4 3,175 22 Car 10 2,991 24 Car 5 2,580 27 Car 11 2,752 25 Car 6 3,730 18 Print Done
Step by Step Solution
There are 3 Steps involved in it

Get step-by-step solutions from verified subject matter experts