

Question: Need help computing the test statistic. Thank You Homework: 7-2 MyStatLab: Module Seven Problem Set Save Score: 1.4 of 7 pts 9 of 10 (10
Need help computing the test statistic. Thank You
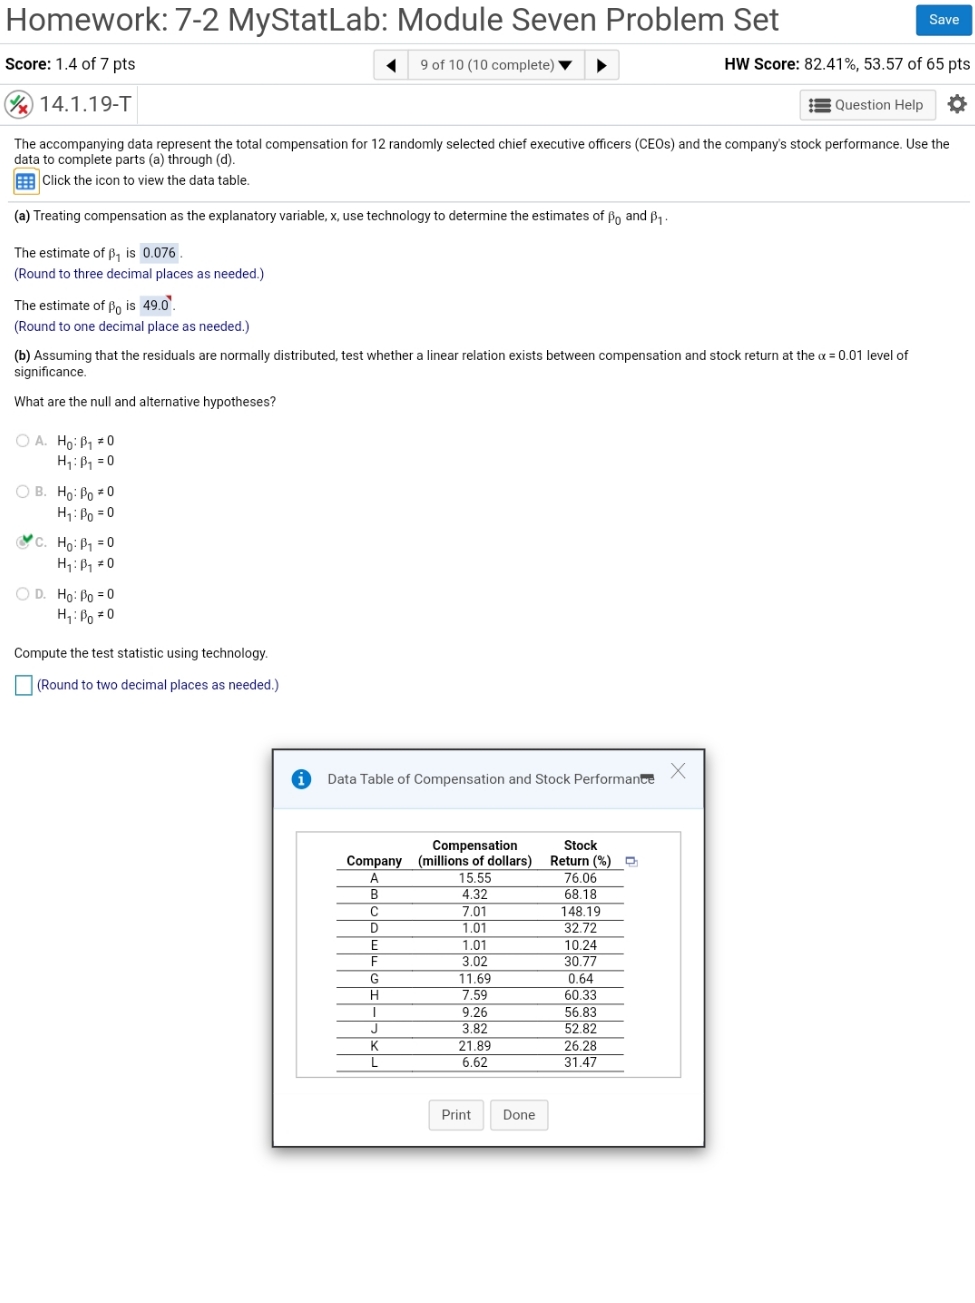
Homework: 7-2 MyStatLab: Module Seven Problem Set Save Score: 1.4 of 7 pts 9 of 10 (10 complete) HW Score: 82.41%, 53.57 of 65 pts Xx 14.1. 19-T Question Help The accompanying data represent the total compensation for 12 randomly selected chief executive officers (CEOs) and the company's stock performance. Use the data to complete parts (a) through (d). Click the icon to view the data table. (@) Treating compensation as the explanatory variable, x, use technology to determine the estimates of Po and B, . The estimate of B, is 0.076 (Round to three decimal places as needed.) The estimate of Po is 49.0 (Round to one decimal place as needed.) (b) Assuming that the residuals are normally distributed, test whether a linear relation exists between compensation and stock return at the or = 0.01 level of significance. What are the null and alternative hypotheses? O A. HO: B1 0 H1: B1 = 0 OB. Ho: Po = 0 H1 : Po = 0 C. Ho: P1 = 0 Hy: P1 =0 O D. Ho: Po = 0 Hy: Po = 0 Compute the test statistic using technology. (Round to two decimal places as needed.) Data Table of Compensation and Stock Performance X Compensation Stock Company (millions of dollars) Return (%) A 15.55 76.06 B 4.32 68.18 C D 7.01 148.19 1.01 32.72 E 1.01 10.24 3.02 30.77 G IG 11.69 0.64 7.59 50.33 9.26 56.83 3.82 52.82 21.89 26.28 6.62 31.47 Print Done
Step by Step Solution
There are 3 Steps involved in it

Get step-by-step solutions from verified subject matter experts