

Question: I need help with question 3 please Threx sells higher-end custom-design socks in three-sock sets (rather than two). The company operates from a small packaging
I need help with question 3 please
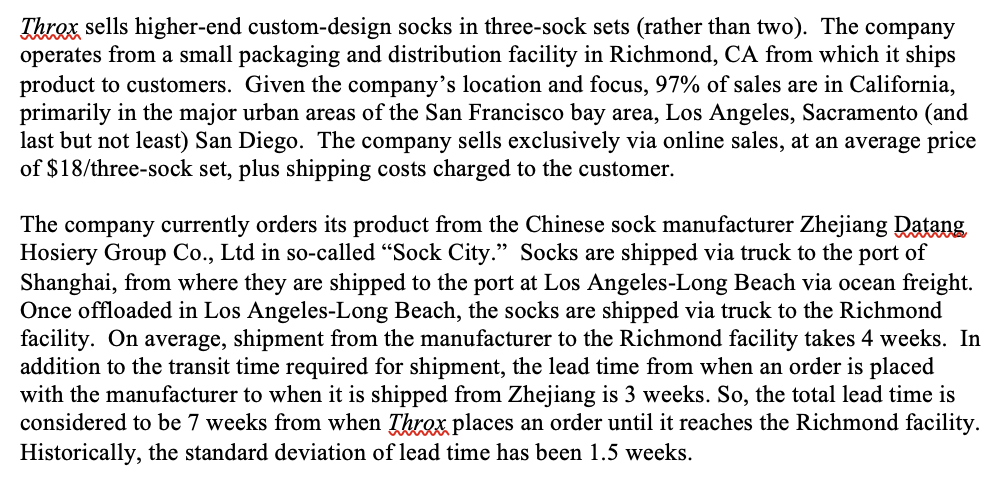
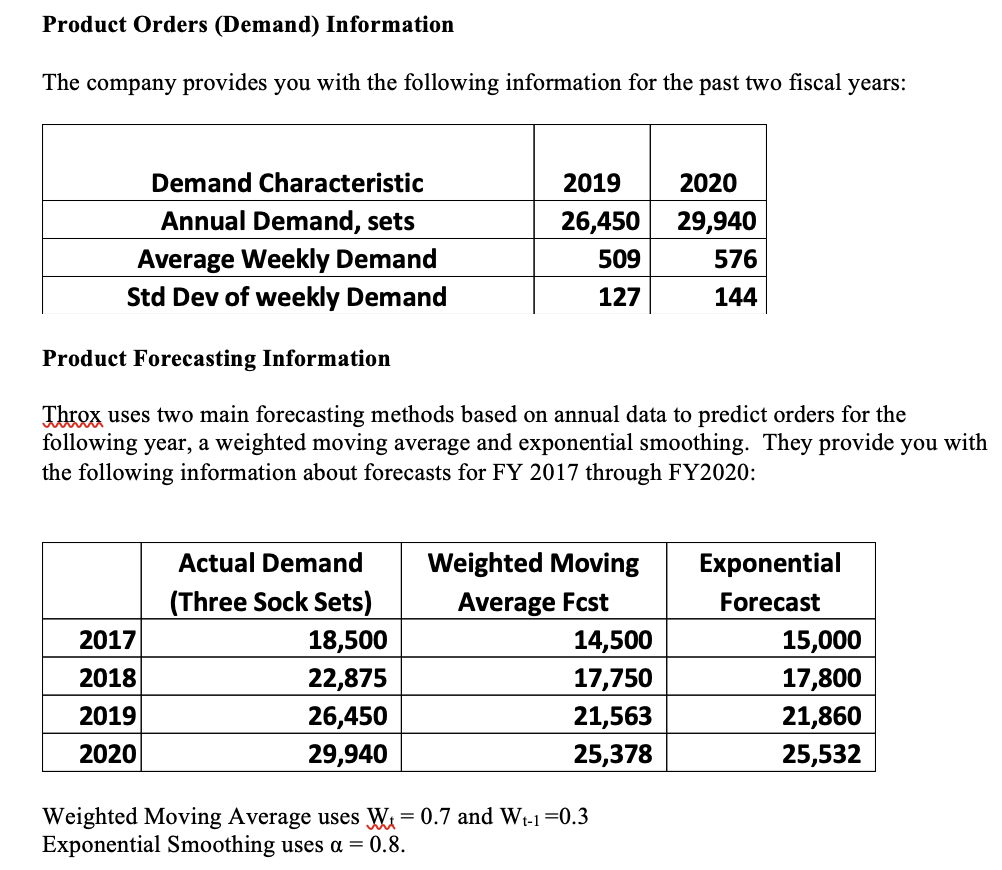
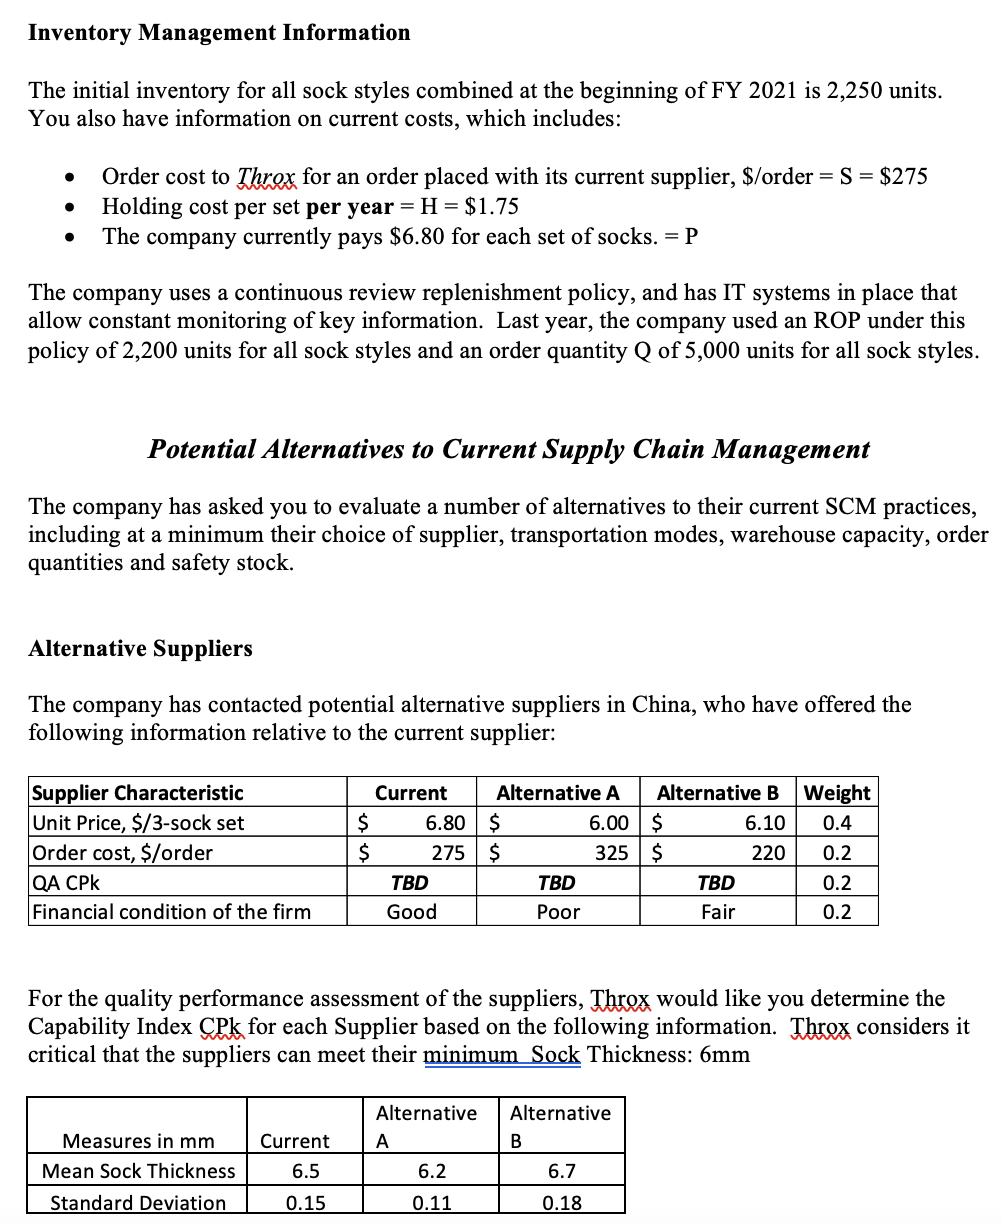
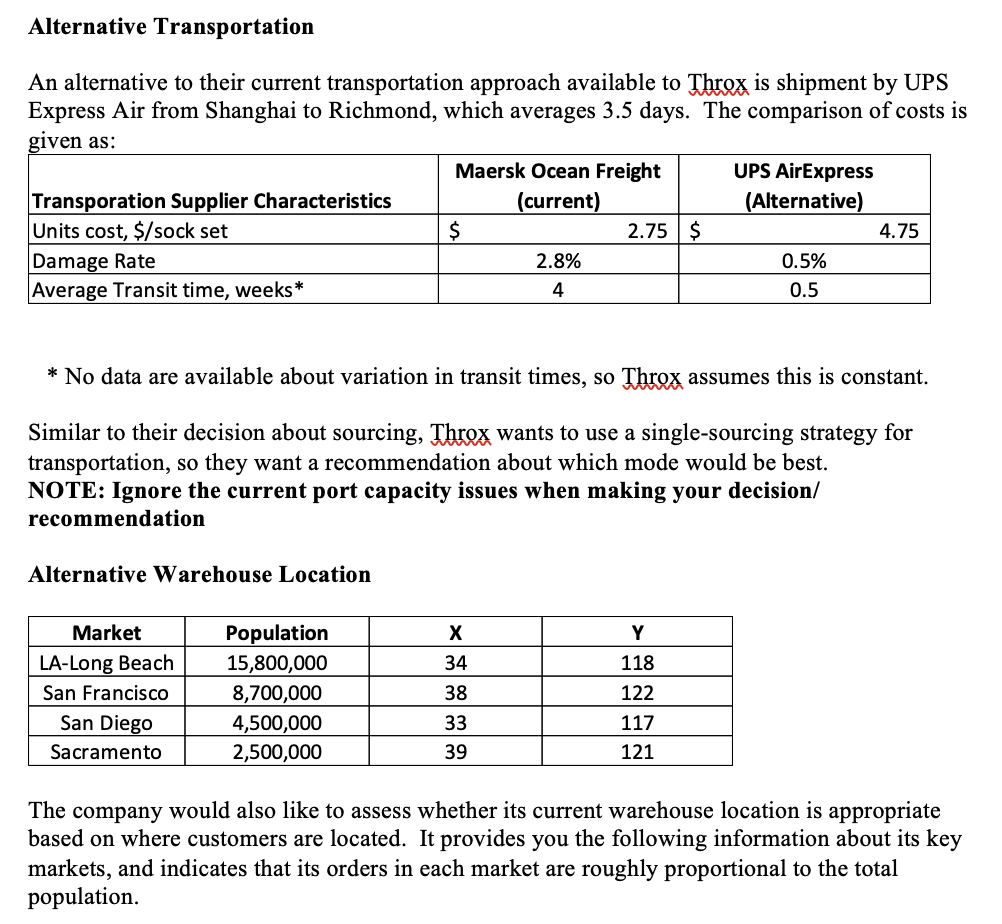
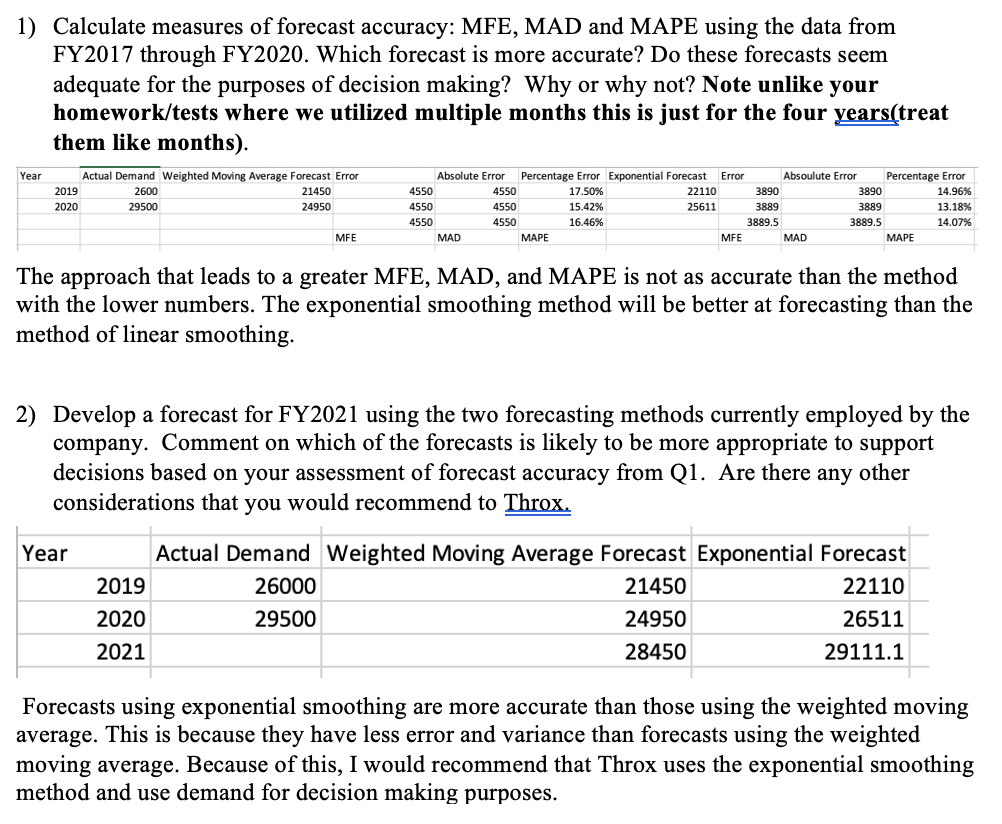
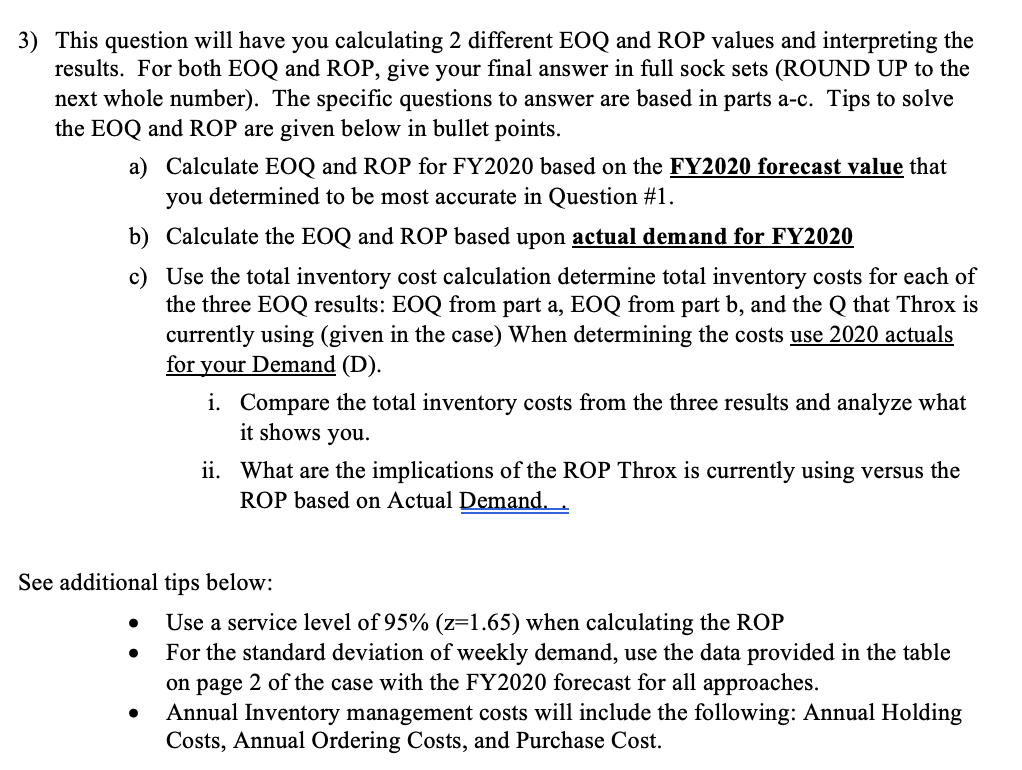
Threx sells higher-end custom-design socks in three-sock sets (rather than two). The company operates from a small packaging and distribution facility in Richmond, CA from which it ships product to customers. Given the company's location and focus, 97% of sales are in California, primarily in the major urban areas of the San Francisco bay area, Los Angeles, Sacramento (and last but not least) San Diego. The company sells exclusively via online sales, at an average price of $18/three-sock set, plus shipping costs charged to the customer. The company currently orders its product from the Chinese sock manufacturer Zhejiang Datang Hosiery Group Co., Ltd in so-called Sock City. Socks are shipped via truck to the port of Shanghai, from where they are shipped to the port at Los Angeles-Long Beach via ocean freight. Once offloaded in Los Angeles-Long Beach, the socks are shipped via truck to the Richmond facility. On average, shipment from the manufacturer to the Richmond facility takes 4 weeks. In addition to the transit time required for shipment, the lead time from when an order is placed with the manufacturer to when it is shipped from Zhejiang is 3 weeks. So, the total lead time is considered to be 7 weeks from when Throx places an order until it reaches the Richmond facility. Historically, the standard deviation of lead time has been 1.5 weeks. Product Orders (Demand) Information The company provides you with the following information for the past two fiscal years: 2019 Demand Characteristic Annual Demand, sets Average Weekly Demand Std Dev of weekly Demand 26,450 509 2020 29,940 576 144 127 Product Forecasting Information Threx uses two main forecasting methods based on annual data to predict orders for the following year, a weighted moving average and exponential smoothing. They provide you with the following information about forecasts for FY 2017 through FY2020: 2017 Actual Demand (Three Sock Sets) 18,500 22,875 26,450 29,940 Weighted Moving Average Fcst 14,500 17,750 21,563 25,378 Exponential Forecast 15,000 17,800 21,860 25,532 2018 2019 2020 = Weighted Moving Average uses Wi = 0.7 and W1-1=0.3 Exponential Smoothing uses a = 0.8. Inventory Management Information The initial inventory for all sock styles combined at the beginning of FY 2021 is 2,250 units. You also have information on current costs, which includes: . . Order cost to Throx for an order placed with its current supplier, $/order = S = $275 Holding cost per set per year = H = $1.75 The company currently pays $6.80 for each set of socks. =P . The company uses a continuous review replenishment policy, and has IT systems in place that allow constant monitoring of key information. Last year, the company used an ROP under this policy of 2,200 units for all sock styles and an order quantity Q of 5,000 units for all sock styles. Potential Alternatives to Current Supply Chain Management The company has asked you to evaluate a number of alternatives to their current SCM practices, including at a minimum their choice of supplier, transportation modes, warehouse capacity, order quantities and safety stock. Alternative Suppliers The company has contacted potential alternative suppliers in China, who have offered the following information relative to the current supplier: Supplier Characteristic Unit Price, $/3-sock set Order cost, $/order QA CPK Financial condition of the firm Current Alternative A Alternative B Weight $ 6.80 $ 6.00 $ 6.10 0.4 $ 275 $ 325$ 220 0.2 TBD TBD TBD 0.2 Good Poor Fair 0.2 For the quality performance assessment of the suppliers, Threx would like you determine the Capability Index CPk for each Supplier based on the following information. Threx considers it critical that the suppliers can meet their minimum Sock Thickness: 6mm Alternative Alternative B A Measures in mm Mean Sock Thickness Current 6.5 6.2 6.7 Standard Deviation 0.15 0.11 0.18 Alternative Transportation An alternative to their current transportation approach available to Threx is shipment by UPS Express Air from Shanghai to Richmond, which averages 3.5 days. The comparison of costs is given as: Maersk Ocean Freight UPS AirExpress Transporation Supplier Characteristics (current) (Alternative) Units cost, $/sock set $ 2.75 $ 4.75 Damage Rate 2.8% 0.5% Average Transit time, weeks * 4 0.5 * No data are available about variation in transit times, so Throx assumes this is constant. Similar to their decision about sourcing, Threx wants to use a single-sourcing strategy for transportation, so they want a recommendation about which mode would be best. NOTE: Ignore the current port capacity issues when making your decision/ recommendation Alternative Warehouse Location X Y 34 Market LA-Long Beach San Francisco San Diego Sacramento Population 15,800,000 8,700,000 4,500,000 2,500,000 38 33 118 122 117 121 39 The company would also like to assess whether its current warehouse location is appropriate based on where customers are located. It provides you the following information about its key markets, and indicates that its orders in each market are roughly proportional to the total population. 1) Calculate measures of forecast accuracy: MFE, MAD and MAPE using the data from FY2017 through FY2020. Which forecast is more accurate? Do these forecasts seem adequate for the purposes of decision making? Why or why not? Note unlike your homework/tests where we utilized multiple months this is just for the four years(treat them like months). Year Actual Demand Weighted Moving Average Forecast Error 2019 2600 21450 2020 29500 24950 Absolute Error Percentage Error Exponential Forecast Error Absoulute Error 4550 Percentage Error 4550 17.50% 22110 3890 3890 14.96% 4550 4550 15.42% 25611 3889 3889 13.18% 4550 4550 16.46% 3889.5 3889.5 14.07% MAD MAPE MFE MAD MAPE MFE The approach that leads to a greater MFE, MAD, and MAPE is not as accurate than the method with the lower numbers. The exponential smoothing method will be better at forecasting than the method of linear smoothing. 2) Develop a forecast for FY2021 using the two forecasting methods currently employed by the company. Comment on which of the forecasts is likely to be more appropriate to support decisions based on your assessment of forecast accuracy from Q1. Are there any other considerations that you would recommend to Throx. Year Actual Demand Weighted Moving Average Forecast Exponential Forecast 2019 26000 21450 22110 2020 29500 24950 26511 2021 28450 29111.1 Forecasts using exponential smoothing are more accurate than those using the weighted moving average. This is because they have less error and variance than forecasts using the weighted moving average. Because of this, I would recommend that Throx uses the exponential smoothing method and use demand for decision making purposes. 3) This question will have you calculating 2 different EOQ and ROP values and interpreting the results. For both EOQ and ROP, give your final answer in full sock sets (ROUND UP to the next whole number). The specific questions to answer are based in parts a-c. Tips to solve the EOQ and ROP are given below in bullet points. a) Calculate EOQ and ROP for FY2020 based on the FY2020 forecast value that you determined to be most accurate in Question #1. b) Calculate the EOQ and ROP based upon actual demand for FY2020 c) Use the total inventory cost calculation determine total inventory costs for each of the three EOQ results: EOQ from part a, EOQ from part b, and the Q that Throx is currently using (given in the case) When determining the costs use 2020 actuals for your Demand (D). i. Compare the total inventory costs from the three results and analyze what it shows you. ii. What are the implications of the ROP Throx is currently using versus the ROP based on Actual Demand.. . See additional tips below: Use a service level of 95% (z=1.65) when calculating the ROP For the standard deviation of weekly demand, use the data provided in the table on page 2 of the case with the FY2020 forecast for all approaches. Annual Inventory management costs will include the following: Annual Holding Costs, Annual Ordering Costs, and Purchase Cost
Step by Step Solution
There are 3 Steps involved in it

Get step-by-step solutions from verified subject matter experts