

Question: I need help with question number 1. please post graph on separate page. thanks Data: Data Table 1. Measurement Readin93 #1 #2 #3 Mass Of
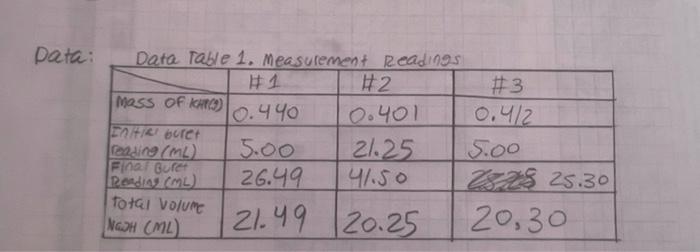
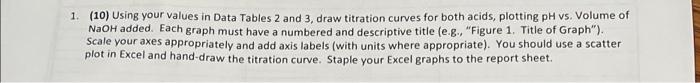
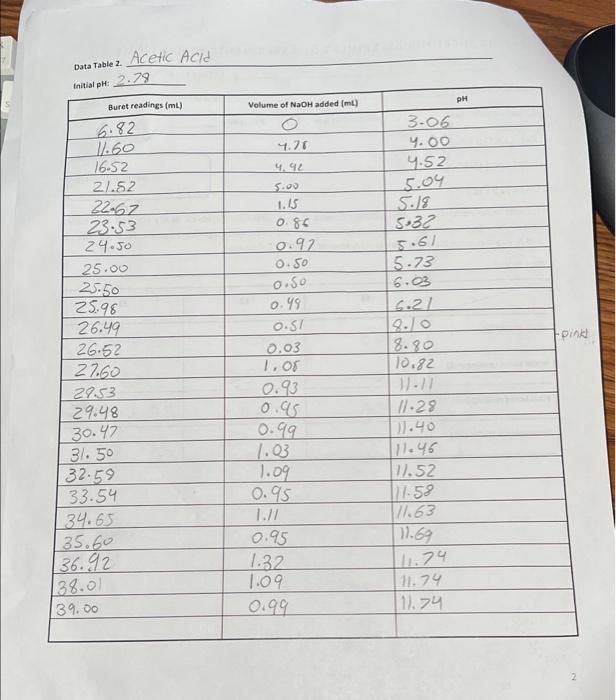
Data: Data Table 1. Measurement Readin93 #1 #2 #3 Mass Of KHCO) 10.440 0.401 0.4/2 ne buret reading (ML) 5.00 21.25 Soo Final Buret Radio) 26.49 41.50 229 25.30 Total volume NG2H (L) 21.49 20.25 20,30 1. (10) Using your values in Data Tables 2 and 3, draw titration curves for both acids, plotting pH vs. Volume of NaOH added. Each graph must have a numbered and descriptive title (e.g., "Figure 1. Title of Graph"). Scale your axes appropriately and add axis labels (with units where appropriate). You should use a scatter plot in Excel and hand-draw the titration curve. Staple your Excel graphs to the report sheet. Acetic Acid Data Table 2 Initial pH: 2:29 pH Buret readings (ml) Volume of NaOH added (ml) 6.82 3.06 4.00 4.52 5.04 5.18 5:32 5.61 5.73 6.03 6.21 Fpink 11.60 16.52 21.52 22.62 23.53 24.50 25.00 25.50 25.98 26.49 26.52 27.60 29.53 29.48 30.47 31.50 32:59 33.54 34.65 35.60 136.92 138.00 39.00 4.76 4.92 5.00 1.15 0.85 0.92 0.50 0.50 0.49 0.57 0.03 1. Os 0.93 0.95 0.99 1.03 1.09 0.95 1.// 0.95 1.32 1.09. 18.80 10.82 11.11 11.29 111.40 [11.46 17.52 117.58 11.63 11.69 11.74 11.74 11.74 2 Data Table 3. Titration of Morochloroacetic Acid Initial pH: 0.61 pH Buret readings (ml) Volume of NaOH added (ml) 2. 20ML 7.20 12.21 17.29 18.32 19.25 20.30 21.22 22.31 23.35 24.21 25.40 5 10.01 15.08 16.03 16.96 18.01 18.93 20.02 21.06 21.92 23.12 23.81 24.41 25.91 26.91 29.21 29.31 30.21 0.61 0.79 1.09 1.48 1.59 1.74 1.80 1.93 2.09 2.22 2.50 2.99 3.49 9.71 12.16 12.97 12.67 12.82 12.92 26.10 26.70 28.10 29.20 30.50 31.60 32.50 3
Step by Step Solution
There are 3 Steps involved in it

Get step-by-step solutions from verified subject matter experts