

Question: I need help with questions 3 through 5 and explanations why they are right. Thank you. We considered the house price example with the house
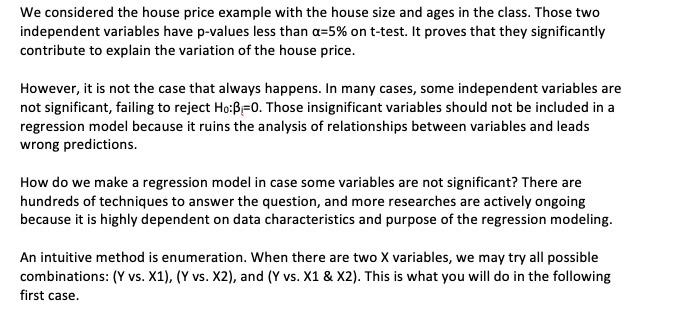
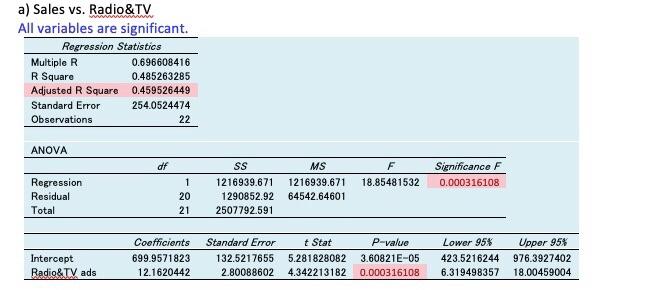
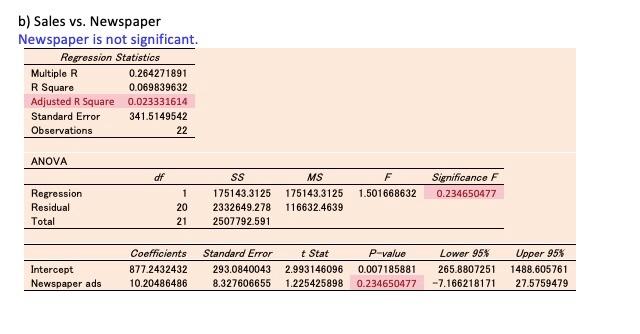
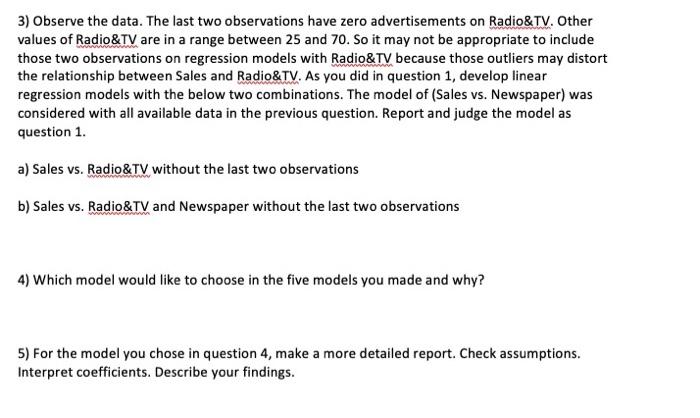
We considered the house price example with the house size and ages in the class. Those two independent variables have p-values less than a=5% on t-test. It proves that they significantly contribute to explain the variation of the house price. However, it is not the case that always happens. In many cases, some independent variables are not significant, failing to reject Ho:B=0. Those insignificant variables should not be included in a regression model because it ruins the analysis of relationships between variables and leads wrong predictions. How do we make a regression model in case some variables are not significant? There are hundreds of techniques to answer the question, and more researches are actively ongoing because it is highly dependent on data characteristics and purpose of the regression modeling. An intuitive method is enumeration. When there are two X variables, we may try all possible combinations: (Y vs. X1), (Y vs. X2), and (Y vs. X1 & X2). This is what you will do in the following first case. w a) Sales vs. Radio & TV All variables are significant. Regression Statistics Multiple R 0.696608416 R Square 0.485263285 Adjusted R Square 0.459526449 Standard Error 254.0524474 Observations 22 ANOVA df ss F 18.85481532 Significance F 0.000316108 Regression Residual Total 1 20 21 MS 1216939.671 64542.64601 1216939.671 1290852.92 2507792.591 Intercept Radio& TV ads Coefficients 699.9571823 12.1620442 Standard Error 132.5217655 2.80088602 t Stat 5.281828082 4.342213182 P-value 3.60821E-05 0.000316108 Lower 95$ 423.5216244 6.319498357 Upper 95% 976.3927402 18.00459004 b) Sales vs. Newspaper Newspaper is not significant. Regression Statistics Multiple R 0.264271891 R Square 0.069839632 Adjusted R Square 0.023331614 Standard Error 341.5149542 Observations 22 ANOVA df F Significance F 0.234650477 Regression Residual Total SS 175143.3125 2332649.278 2507792.591 MS 175143.3125 116632.4639 1 20 21 1.501668632 Intercept Newspaper ads Coefficients 877.2432432 10.20486486 Standard Error 293.0840043 8.327606655 t Stat 2.993146096 1.225425898 p-value 0.007185881 0.234650477 Lower 95% 265.8807251 -7.166218171 Upper 95% 1488.605761 27.5759479 3) Observe the data. The last two observations have zero advertisements on Radio&TV. Other values of Radio&TV are in a range between 25 and 70. So it may not be appropriate to include those two observations on regression models with Radio&TV because those outliers may distort the relationship between Sales and Radio&TV. As you did in question 1, develop linear regression models with the below two combinations. The model of (Sales vs. Newspaper) was considered with all available data in the previous question. Report and judge the model as question 1. a) Sales vs. Radio&TV without the last two observations b) Sales vs. Radio&TV and Newspaper without the last two observations 4) Which model would like to choose in the five models you made and why? 5) For the model you chose in question 4, make a more detailed report. Check assumptions. Interpret coefficients. Describe your findings. We considered the house price example with the house size and ages in the class. Those two independent variables have p-values less than a=5% on t-test. It proves that they significantly contribute to explain the variation of the house price. However, it is not the case that always happens. In many cases, some independent variables are not significant, failing to reject Ho:B=0. Those insignificant variables should not be included in a regression model because it ruins the analysis of relationships between variables and leads wrong predictions. How do we make a regression model in case some variables are not significant? There are hundreds of techniques to answer the question, and more researches are actively ongoing because it is highly dependent on data characteristics and purpose of the regression modeling. An intuitive method is enumeration. When there are two X variables, we may try all possible combinations: (Y vs. X1), (Y vs. X2), and (Y vs. X1 & X2). This is what you will do in the following first case. w a) Sales vs. Radio & TV All variables are significant. Regression Statistics Multiple R 0.696608416 R Square 0.485263285 Adjusted R Square 0.459526449 Standard Error 254.0524474 Observations 22 ANOVA df ss F 18.85481532 Significance F 0.000316108 Regression Residual Total 1 20 21 MS 1216939.671 64542.64601 1216939.671 1290852.92 2507792.591 Intercept Radio& TV ads Coefficients 699.9571823 12.1620442 Standard Error 132.5217655 2.80088602 t Stat 5.281828082 4.342213182 P-value 3.60821E-05 0.000316108 Lower 95$ 423.5216244 6.319498357 Upper 95% 976.3927402 18.00459004 b) Sales vs. Newspaper Newspaper is not significant. Regression Statistics Multiple R 0.264271891 R Square 0.069839632 Adjusted R Square 0.023331614 Standard Error 341.5149542 Observations 22 ANOVA df F Significance F 0.234650477 Regression Residual Total SS 175143.3125 2332649.278 2507792.591 MS 175143.3125 116632.4639 1 20 21 1.501668632 Intercept Newspaper ads Coefficients 877.2432432 10.20486486 Standard Error 293.0840043 8.327606655 t Stat 2.993146096 1.225425898 p-value 0.007185881 0.234650477 Lower 95% 265.8807251 -7.166218171 Upper 95% 1488.605761 27.5759479 3) Observe the data. The last two observations have zero advertisements on Radio&TV. Other values of Radio&TV are in a range between 25 and 70. So it may not be appropriate to include those two observations on regression models with Radio&TV because those outliers may distort the relationship between Sales and Radio&TV. As you did in question 1, develop linear regression models with the below two combinations. The model of (Sales vs. Newspaper) was considered with all available data in the previous question. Report and judge the model as question 1. a) Sales vs. Radio&TV without the last two observations b) Sales vs. Radio&TV and Newspaper without the last two observations 4) Which model would like to choose in the five models you made and why? 5) For the model you chose in question 4, make a more detailed report. Check assumptions. Interpret coefficients. Describe your findings
Step by Step Solution
There are 3 Steps involved in it

Get step-by-step solutions from verified subject matter experts