

Question: I need help with starting task one. I might be on the right track but I would like to know you can help me with
 I need help with starting task one. I might be on the right track but I would like to know you can help me with task one.
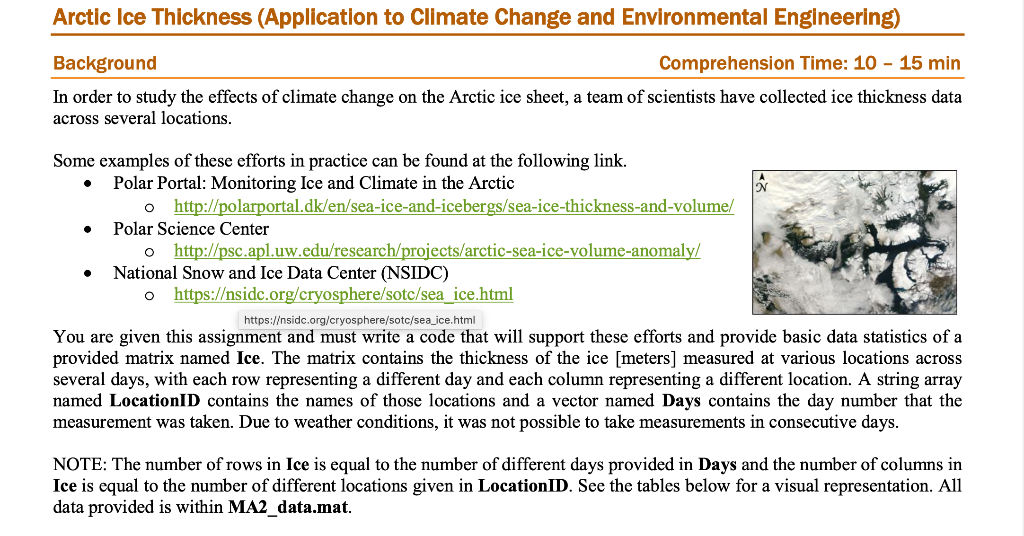
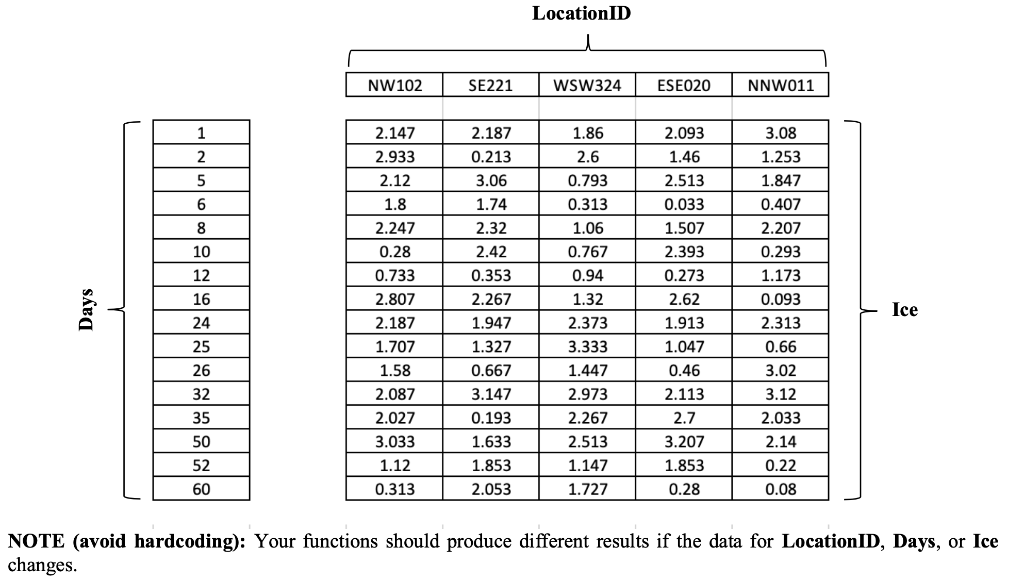
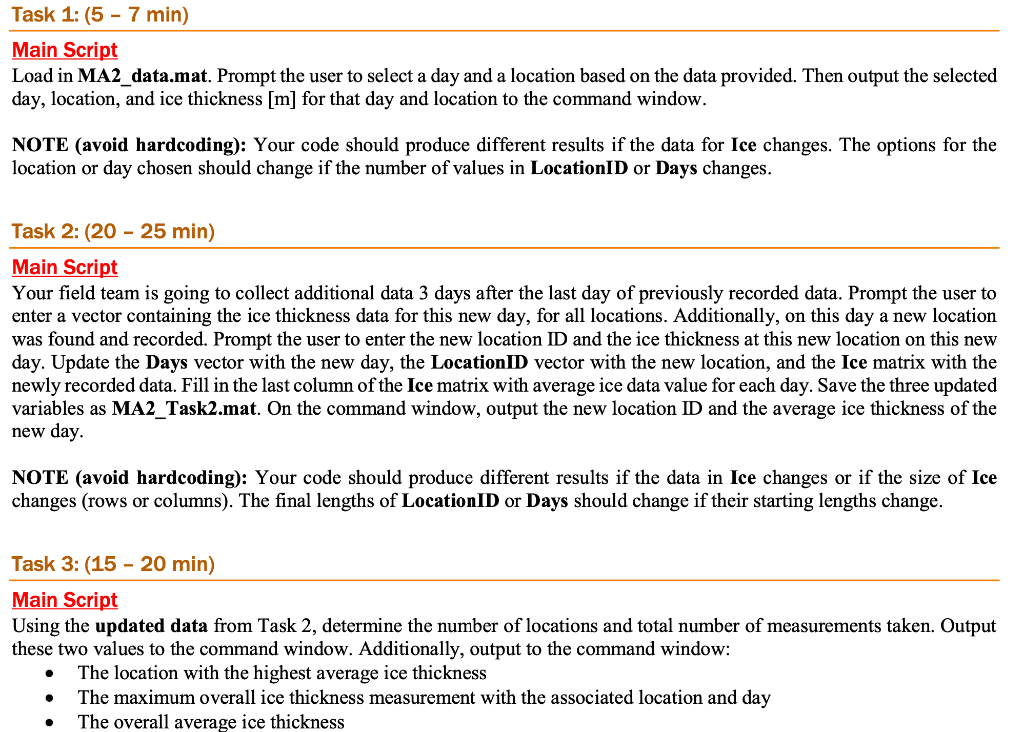
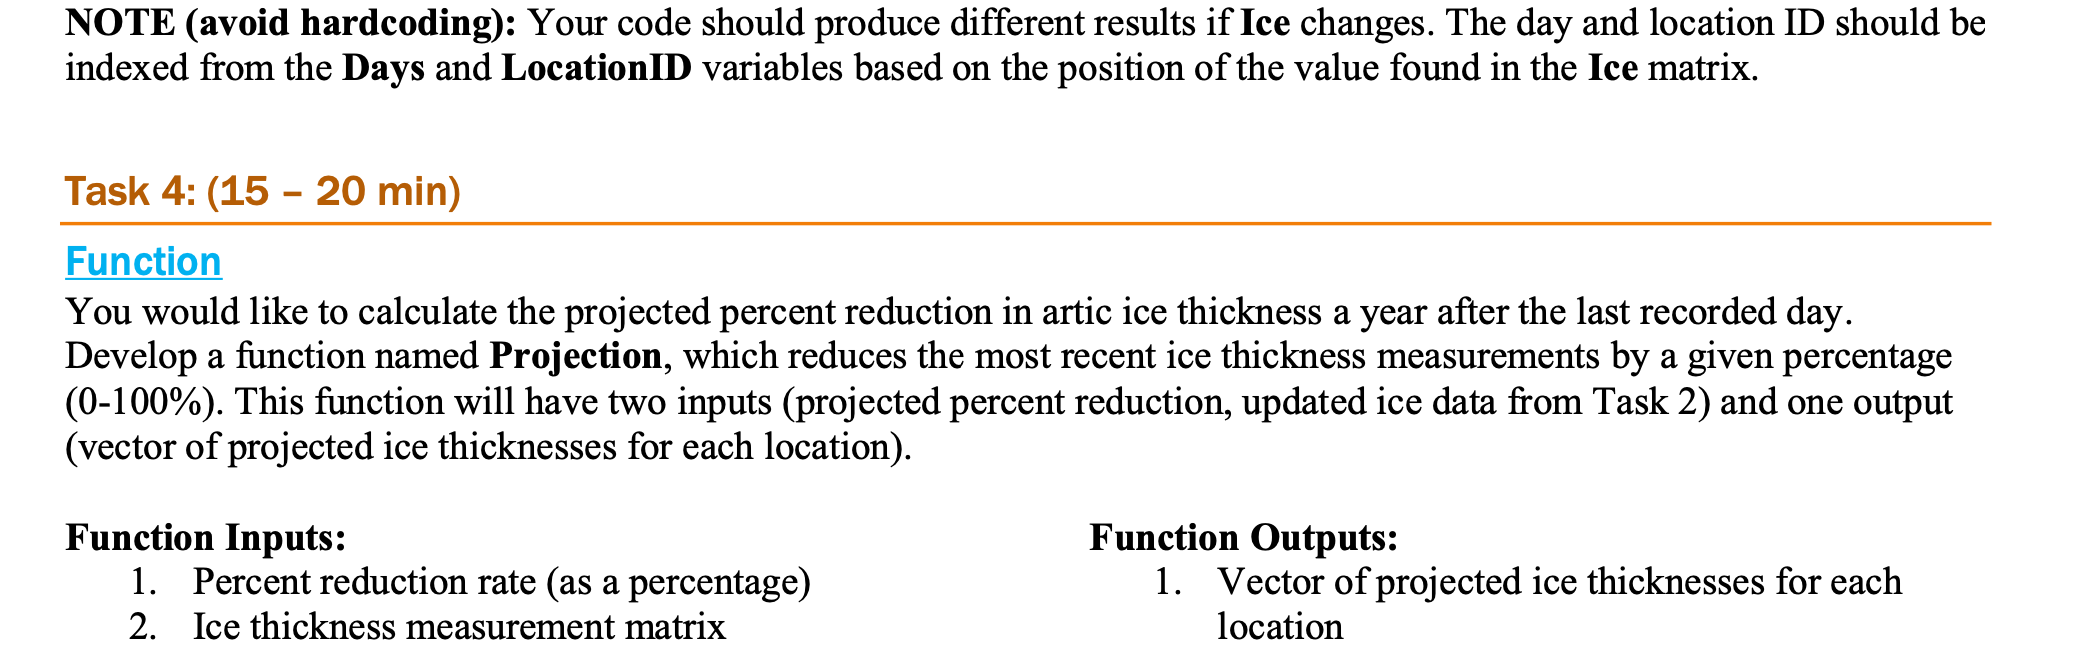
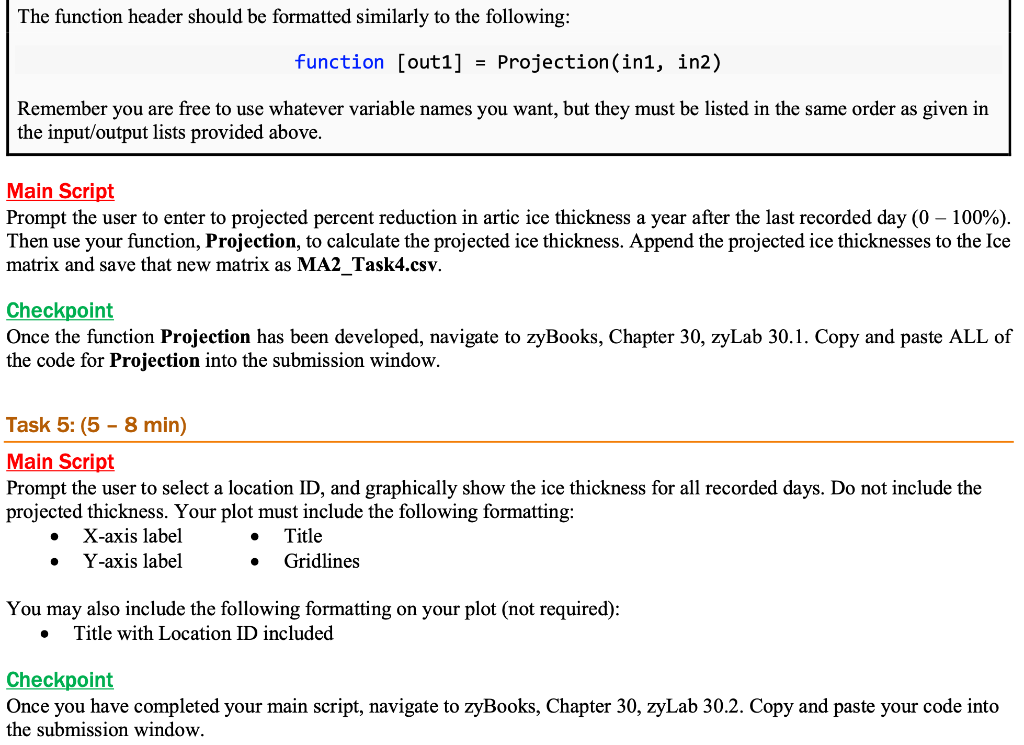
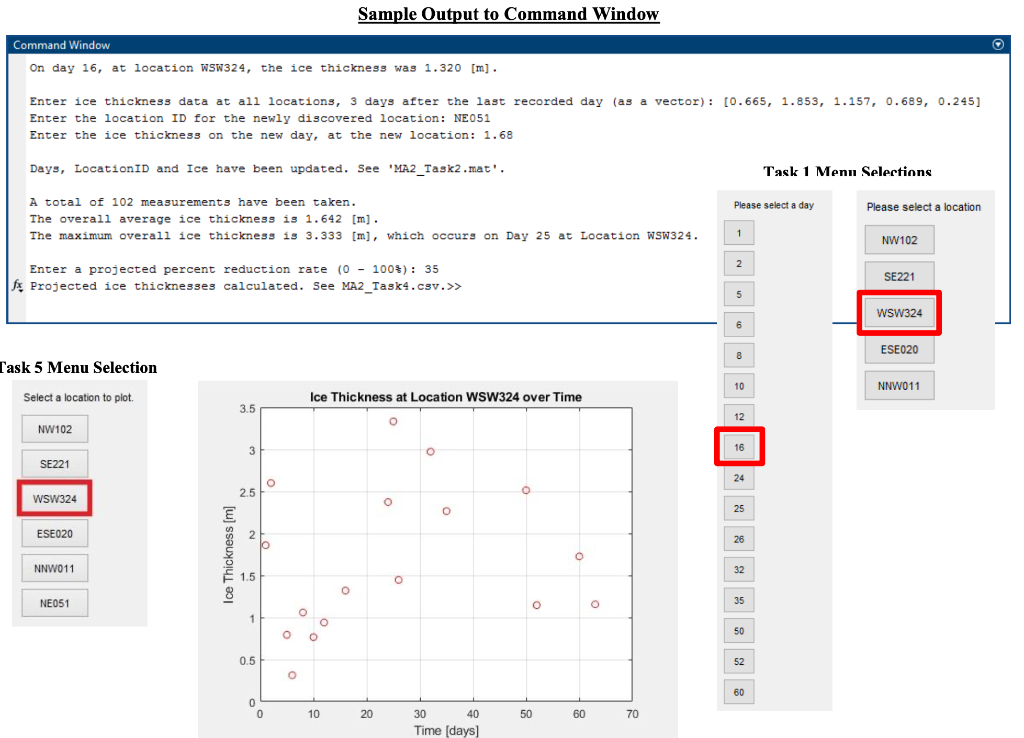
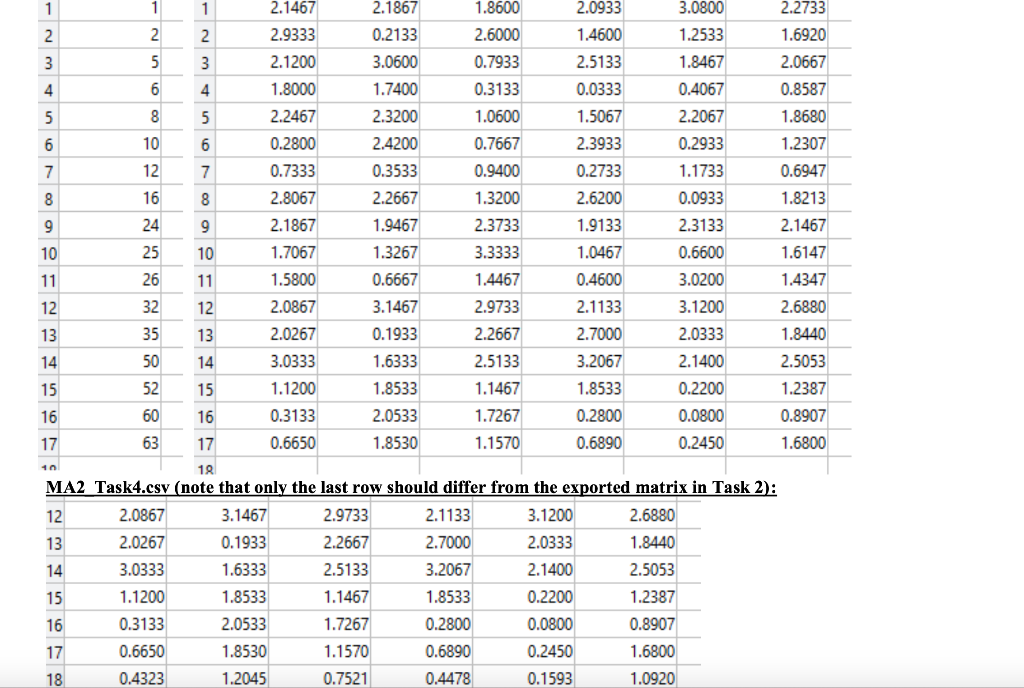
MATLAB Assignment Instructions: This assignment has one problem, summarized below. You will use MATLAB as a tool to develop your solution to the problem for the given test cases, ensuring that your code is flexible for any additional test cases that might be used to evaluate it. All outputs to the command window should be formatted, and intermediate calculations should be suppressed with a semicolon. Use comments to summarize the problem statement and to denote where each task / function call begins in your main script. zyBooks Instructions: After completing this assignment in MATLAB, to receive credit, you must submit your code in zyBooks. This problem consists of a single, user-defined function and a main script. To receive credit for the user-defined function, your function header must conform to the following guidelines: Your function must have the same name as given in the problem prompt The number of inputs and outputs to your function must be the same as given in the prompt and the order in which they are listed in your function header must also be the same. However, you can use any names you'd like for your function input and output variables. To help debug and troubleshoot your main script, a correctly coded version of the user-defined function necessary to complete this problem has been provided to you as .p file. This can be used exactly the same as a .m function file, except that it cannot be opened in MATLAB and the code cannot be edited. To submit your main script in zyBooks, copy and paste your entire main script code into the main script checkpoint submission window, making sure to remove any housekeeping commands. To receive full credit, make sure your code produces correct output to the command window, file exports, and plots. You may submit to zyBooks as many times as you want before the deadline, without any penalty. All checkpoints are due before the due date. No credit will be given if it is not submitted through the zyBooks platform before the deadline. Credit for each checkpoint will be awarded based upon the percentage of successfully completed assessments. Proficiency Times: Times are included with the Background and Task sections. These times are the estimated amount of time it should take you to redo an assignment once you are fully proficient in the material that it covers. To practice, reread the background in the given Comprehension Time and attempt to complete the problem in the given Proficiency Time. Arctic Ice Thickness (Application to Climate Change and Environmental Engineering) Background Comprehension Time: 10 - 15 min In order to study the effects of climate change on the Arctic ice sheet, a team of scientists have collected ice thickness data across several locations. N O 0 Some examples of these efforts in practice can be found at the following link. Polar Portal: Monitoring Ice and Climate in the Arctic http://polarportal.dk/en/sea-ice-and-icebergs/sea-ice-thickness-and-volume/ Polar Science Center http://psc.apl.uw.edu/research/projects/arctic-sea-ice-volume-anomaly/ National Snow and Ice Data Center (NSIDC) o https:/sidc.org/cryosphere/sotc/sea ice.html https:/sidc.org/cryosphere/sotc/sea_ice.html You are given this assignment and must write a code that will support these efforts and provide basic data statistics of a provided matrix named Ice. The matrix contains the thickness of the ice [meters] measured at various locations across several days, with each row representing a different day and each column representing a different location. A string array named LocationID contains the names of those locations and a vector named Days contains the day number that the measurement was taken. Due to weather conditions, it was not possible to take measurements in consecutive days. NOTE: The number of rows in Ice is equal to the number of different days provided in Days and the number of columns in Ice is equal to the number of different locations given in LocationID. See the tables below for a visual representation. All data provided is within MA2_data.mat. LocationID NW102 SE221 WSW324 ESE020 NNW011 1 2.147 2.093 2.187 0.213 1.86 2.6 1.46 2.513 3.06 0.033 Days 2 5 6 8 10 12 16 24 25 26 32 35 50 52 60 Ice 2.933 2.12 1.8 2.247 0.28 0.733 2.807 2.187 1.707 1.58 2.087 2.027 3.033 1.12 0.313 1.74 2.32 2.42 0.353 2.267 1.947 1.327 0.667 3.147 0.193 1.633 1.853 2.053 3.08 1.253 1.847 0.407 2.207 0.293 1.173 0.093 2.313 0.66 3.02 3.12 2.033 2.14 0.793 0.313 1.06 0.767 0.94 1.32 2.373 3.333 1.447 2.973 2.267 2.513 1.147 1.727 1.507 2.393 0.273 2.62 1.913 1.047 0.46 2.113 2.7 3.207 1.853 0.28 0.22 0.08 NOTE (avoid hardcoding): Your functions should produce different results if the data for LocationID, Days, or Ice changes. Task 1: (5 - 7 min) Main Script Load in MA2_data.mat. Prompt the user to select a day and a location based on the data provided. Then output the selected day, location, and ice thickness [m] for that day and location to the command window. NOTE (avoid hardcoding): Your code should produce different results if the data for Ice changes. The options for the location or day chosen should change if the number of values in LocationID or Days changes. Task 2: (20 - 25 min) Main Script Your field team is going to collect additional data 3 days after the last day of previously recorded data. Prompt the user to enter a vector containing the ice thickness data for this new day, for all locations. Additionally, on this day a new location was found and recorded. Prompt the user to enter the new location ID and the ice thickness at this new location on this new day. Update the Days vector with the new day, the Location ID vector with the new location, and the Ice matrix with the newly recorded data. Fill in the last column of the Ice matrix with average ice data value for each day. Save the three updated variables as MA2_Task2.mat. On the command window, output the new location ID and the average ice thickness of the new day. NOTE (avoid hardcoding): Your code should produce different results if the data in Ice changes or if the size of Ice changes (rows or columns). The final lengths of Location ID or Days should change if their starting lengths change. Task 3: (15 - 20 min) Main Script Using the updated data from Task 2, determine the number of locations and total number of measurements taken. Output these two values to the command window. Additionally, output to the command window: The location with the highest average ice thickness The maximum overall ice thickness measurement with the associated location and day The overall average ice thickness NOTE (avoid hardcoding): Your code should produce different results if Ice changes. The day and location ID should be indexed from the Days and LocationID variables based on the position of the value found in the Ice matrix. Task 4: (15-20 min) Function You would like to calculate the projected percent reduction in artic ice thickness a year after the last recorded day. Develop a function named Projection, which reduces the most recent ice thickness measurements by a given percentage (0-100%). This function will have two inputs (projected percent reduction, updated ice data from Task 2) and one output (vector of projected ice thicknesses for each location). Function Inputs: 1. Percent reduction rate (as a percentage) 2. Ice thickness measurement matrix Function Outputs: 1. Vector of projected ice thicknesses for each location The function header should be formatted similarly to the following: function [out1] = Projection(ini, in2) Remember you are free to use whatever variable names you want, but they must be listed in the same order as given in the input/output lists provided above. Main Script Prompt the user to enter to projected percent reduction in artic ice thickness a year after the last recorded day (0 - 100%). Then use your function, Projection, to calculate the projected ice thickness. Append the projected ice thicknesses to the Ice matrix and save that new matrix as MA2_Task4.csv. Checkpoint Once the function Projection has been developed, navigate to zyBooks, Chapter 30, zyLab 30.1. Copy and paste ALL of the code for Projection into the submission window. Task 5: (5-8 min) Main Script Prompt the user to select a location ID, and graphically show the ice thickness for all recorded days. Do not include the projected thickness. Your plot must include the following formatting: X-axis label Title Y-axis label Gridlines O O You may also include the following formatting on your plot (not required): Title with Location ID included Checkpoint Once you have completed your main script, navigate to zyBooks, Chapter 30, zyLab 30.2. Copy and paste your code into the submission window. Sample Output to Command Window Command Window o On day 16, at location WSW324, the ice thickness was 1.320 [m]. Enter ice thickness data at all locations, 3 days after the last recorded day (as a vector): [0.665, 1.853, 1.157, 0.689, 0.245] Enter the location ID for the newly discovered location: NE 051 Enter the ice thickness on the new day, at the new location: 1.68 Days, LocationID and Ice have been updated. See 'MA2_Task2.mat'. Task 1 Menu Selections Please select a day Please select a location A total of 102 measurements have been taken. The overall average ice thickness is 1.642 [m] . The maximum overall ice thickness is 3.333 [m], which occurs on Day 25 at Location WSW324. 1 NW102 2 Enter a projected percent reduction rate (0 - 100%): 35 fx Projected ice thicknesses calculated. See MA2_Task4.csv.>> SE221 5 WSW324 6 ESE020 8 Task 5 Menu Selection 10 NNW011 Select a location to plot Ice Thickness at Location WSW324 over Time 3.5 12 NW102 3 O 16 SE221 24 O 2.5 WSW324 O 25 ESE020 2 26 Ice Thickness [m] O NNW011 32 1.5 o o NE051 35 1 o 0 50 0.5 52 0 60 0 0 10 20 50 60 70 30 40 Time (days) 1 1 1 2.1467 2.1867 1.8600 2.0933 3.0800 2.2733 2. 2 2 2.9333 0.2133 2.6000 1.4600 1.2533 1.6920 3 5 3 2.1200 3.0600 0.7933 2.5133 1.8467 2.0667 4 6 4 1.8000 1.7400 0.3133 0.0333 0.4067 0.8587 5 8 5 2.2467 2.3200 1.0600 1.5067 2.2067 1.8680 6 10 6 0.2800 2.4200 0.7667 2.3933 0.2933 1.2307 7 12 7 0.7333 0.3533 0.9400 0.2733 1.1733 0.6947 8 16 8 2.8067 2.2667 1.3200 2.6200 0.0933 1.8213 9 24 9 2.1867 1.9467 2.3733 1.9133 2.3133 2.1467 10 25 10 1.7067 1.3267 3.3333 1.0467 0.6600 1.6147 11 26 11 1.5800 0.6667 1.4467 0.4600 3.0200 1.4347 12 32 12 2.0867 3.1467 2.9733 2.1133 3.1200 2.6880 13 35 13 2.0267 0.1933 2.2667 2.7000 2.0333 1.8440 14 50 14 3.0333 1.6333 2.5133 3.2067 2.1400 2.5053 15 52 15 1.1200 1.8533 1.1467 1.8533 0.2200 1.2387 16 60 16 0.3133 2.0533 1.7267 0.2800 0.0800 0.8907 17 63 17 0.6650 1.8530 1.1570 0.6890 0.2450 1.6800 18 MA2 Task4.csv (note that only the last row should differ from the exported matrix in Task 2): 12 2.0867 3.1467 2.9733 2.1133 3.1200 2.6880 13 2.0267 0.1933 2.2667 2.7000 2.0333 1.8440 14 3.0333 1.6333 2.5133 3.2067 2.1400 2.5053 15 1.1200 1.8533 1.1467 1.8533 0.2200 1.2387 16 0.3133 2.0533 1.7267 0.2800 0.0800 0.8907 17 0.6650 1.8530 1.1570 0.6890 0.2450 1.6800 18 0.4323 1.2045 0.7521 0.4478 0.1593 1.0920 10 MATLAB Assignment Instructions: This assignment has one problem, summarized below. You will use MATLAB as a tool to develop your solution to the problem for the given test cases, ensuring that your code is flexible for any additional test cases that might be used to evaluate it. All outputs to the command window should be formatted, and intermediate calculations should be suppressed with a semicolon. Use comments to summarize the problem statement and to denote where each task / function call begins in your main script. zyBooks Instructions: After completing this assignment in MATLAB, to receive credit, you must submit your code in zyBooks. This problem consists of a single, user-defined function and a main script. To receive credit for the user-defined function, your function header must conform to the following guidelines: Your function must have the same name as given in the problem prompt The number of inputs and outputs to your function must be the same as given in the prompt and the order in which they are listed in your function header must also be the same. However, you can use any names you'd like for your function input and output variables. To help debug and troubleshoot your main script, a correctly coded version of the user-defined function necessary to complete this problem has been provided to you as .p file. This can be used exactly the same as a .m function file, except that it cannot be opened in MATLAB and the code cannot be edited. To submit your main script in zyBooks, copy and paste your entire main script code into the main script checkpoint submission window, making sure to remove any housekeeping commands. To receive full credit, make sure your code produces correct output to the command window, file exports, and plots. You may submit to zyBooks as many times as you want before the deadline, without any penalty. All checkpoints are due before the due date. No credit will be given if it is not submitted through the zyBooks platform before the deadline. Credit for each checkpoint will be awarded based upon the percentage of successfully completed assessments. Proficiency Times: Times are included with the Background and Task sections. These times are the estimated amount of time it should take you to redo an assignment once you are fully proficient in the material that it covers. To practice, reread the background in the given Comprehension Time and attempt to complete the problem in the given Proficiency Time. Arctic Ice Thickness (Application to Climate Change and Environmental Engineering) Background Comprehension Time: 10 - 15 min In order to study the effects of climate change on the Arctic ice sheet, a team of scientists have collected ice thickness data across several locations. N O 0 Some examples of these efforts in practice can be found at the following link. Polar Portal: Monitoring Ice and Climate in the Arctic http://polarportal.dk/en/sea-ice-and-icebergs/sea-ice-thickness-and-volume/ Polar Science Center http://psc.apl.uw.edu/research/projects/arctic-sea-ice-volume-anomaly/ National Snow and Ice Data Center (NSIDC) o https:/sidc.org/cryosphere/sotc/sea ice.html https:/sidc.org/cryosphere/sotc/sea_ice.html You are given this assignment and must write a code that will support these efforts and provide basic data statistics of a provided matrix named Ice. The matrix contains the thickness of the ice [meters] measured at various locations across several days, with each row representing a different day and each column representing a different location. A string array named LocationID contains the names of those locations and a vector named Days contains the day number that the measurement was taken. Due to weather conditions, it was not possible to take measurements in consecutive days. NOTE: The number of rows in Ice is equal to the number of different days provided in Days and the number of columns in Ice is equal to the number of different locations given in LocationID. See the tables below for a visual representation. All data provided is within MA2_data.mat. LocationID NW102 SE221 WSW324 ESE020 NNW011 1 2.147 2.093 2.187 0.213 1.86 2.6 1.46 2.513 3.06 0.033 Days 2 5 6 8 10 12 16 24 25 26 32 35 50 52 60 Ice 2.933 2.12 1.8 2.247 0.28 0.733 2.807 2.187 1.707 1.58 2.087 2.027 3.033 1.12 0.313 1.74 2.32 2.42 0.353 2.267 1.947 1.327 0.667 3.147 0.193 1.633 1.853 2.053 3.08 1.253 1.847 0.407 2.207 0.293 1.173 0.093 2.313 0.66 3.02 3.12 2.033 2.14 0.793 0.313 1.06 0.767 0.94 1.32 2.373 3.333 1.447 2.973 2.267 2.513 1.147 1.727 1.507 2.393 0.273 2.62 1.913 1.047 0.46 2.113 2.7 3.207 1.853 0.28 0.22 0.08 NOTE (avoid hardcoding): Your functions should produce different results if the data for LocationID, Days, or Ice changes. Task 1: (5 - 7 min) Main Script Load in MA2_data.mat. Prompt the user to select a day and a location based on the data provided. Then output the selected day, location, and ice thickness [m] for that day and location to the command window. NOTE (avoid hardcoding): Your code should produce different results if the data for Ice changes. The options for the location or day chosen should change if the number of values in LocationID or Days changes. Task 2: (20 - 25 min) Main Script Your field team is going to collect additional data 3 days after the last day of previously recorded data. Prompt the user to enter a vector containing the ice thickness data for this new day, for all locations. Additionally, on this day a new location was found and recorded. Prompt the user to enter the new location ID and the ice thickness at this new location on this new day. Update the Days vector with the new day, the Location ID vector with the new location, and the Ice matrix with the newly recorded data. Fill in the last column of the Ice matrix with average ice data value for each day. Save the three updated variables as MA2_Task2.mat. On the command window, output the new location ID and the average ice thickness of the new day. NOTE (avoid hardcoding): Your code should produce different results if the data in Ice changes or if the size of Ice changes (rows or columns). The final lengths of Location ID or Days should change if their starting lengths change. Task 3: (15 - 20 min) Main Script Using the updated data from Task 2, determine the number of locations and total number of measurements taken. Output these two values to the command window. Additionally, output to the command window: The location with the highest average ice thickness The maximum overall ice thickness measurement with the associated location and day The overall average ice thickness NOTE (avoid hardcoding): Your code should produce different results if Ice changes. The day and location ID should be indexed from the Days and LocationID variables based on the position of the value found in the Ice matrix. Task 4: (15-20 min) Function You would like to calculate the projected percent reduction in artic ice thickness a year after the last recorded day. Develop a function named Projection, which reduces the most recent ice thickness measurements by a given percentage (0-100%). This function will have two inputs (projected percent reduction, updated ice data from Task 2) and one output (vector of projected ice thicknesses for each location). Function Inputs: 1. Percent reduction rate (as a percentage) 2. Ice thickness measurement matrix Function Outputs: 1. Vector of projected ice thicknesses for each location The function header should be formatted similarly to the following: function [out1] = Projection(ini, in2) Remember you are free to use whatever variable names you want, but they must be listed in the same order as given in the input/output lists provided above. Main Script Prompt the user to enter to projected percent reduction in artic ice thickness a year after the last recorded day (0 - 100%). Then use your function, Projection, to calculate the projected ice thickness. Append the projected ice thicknesses to the Ice matrix and save that new matrix as MA2_Task4.csv. Checkpoint Once the function Projection has been developed, navigate to zyBooks, Chapter 30, zyLab 30.1. Copy and paste ALL of the code for Projection into the submission window. Task 5: (5-8 min) Main Script Prompt the user to select a location ID, and graphically show the ice thickness for all recorded days. Do not include the projected thickness. Your plot must include the following formatting: X-axis label Title Y-axis label Gridlines O O You may also include the following formatting on your plot (not required): Title with Location ID included Checkpoint Once you have completed your main script, navigate to zyBooks, Chapter 30, zyLab 30.2. Copy and paste your code into the submission window. Sample Output to Command Window Command Window o On day 16, at location WSW324, the ice thickness was 1.320 [m]. Enter ice thickness data at all locations, 3 days after the last recorded day (as a vector): [0.665, 1.853, 1.157, 0.689, 0.245] Enter the location ID for the newly discovered location: NE 051 Enter the ice thickness on the new day, at the new location: 1.68 Days, LocationID and Ice have been updated. See 'MA2_Task2.mat'. Task 1 Menu Selections Please select a day Please select a location A total of 102 measurements have been taken. The overall average ice thickness is 1.642 [m] . The maximum overall ice thickness is 3.333 [m], which occurs on Day 25 at Location WSW324. 1 NW102 2 Enter a projected percent reduction rate (0 - 100%): 35 fx Projected ice thicknesses calculated. See MA2_Task4.csv.>> SE221 5 WSW324 6 ESE020 8 Task 5 Menu Selection 10 NNW011 Select a location to plot Ice Thickness at Location WSW324 over Time 3.5 12 NW102 3 O 16 SE221 24 O 2.5 WSW324 O 25 ESE020 2 26 Ice Thickness [m] O NNW011 32 1.5 o o NE051 35 1 o 0 50 0.5 52 0 60 0 0 10 20 50 60 70 30 40 Time (days) 1 1 1 2.1467 2.1867 1.8600 2.0933 3.0800 2.2733 2. 2 2 2.9333 0.2133 2.6000 1.4600 1.2533 1.6920 3 5 3 2.1200 3.0600 0.7933 2.5133 1.8467 2.0667 4 6 4 1.8000 1.7400 0.3133 0.0333 0.4067 0.8587 5 8 5 2.2467 2.3200 1.0600 1.5067 2.2067 1.8680 6 10 6 0.2800 2.4200 0.7667 2.3933 0.2933 1.2307 7 12 7 0.7333 0.3533 0.9400 0.2733 1.1733 0.6947 8 16 8 2.8067 2.2667 1.3200 2.6200 0.0933 1.8213 9 24 9 2.1867 1.9467 2.3733 1.9133 2.3133 2.1467 10 25 10 1.7067 1.3267 3.3333 1.0467 0.6600 1.6147 11 26 11 1.5800 0.6667 1.4467 0.4600 3.0200 1.4347 12 32 12 2.0867 3.1467 2.9733 2.1133 3.1200 2.6880 13 35 13 2.0267 0.1933 2.2667 2.7000 2.0333 1.8440 14 50 14 3.0333 1.6333 2.5133 3.2067 2.1400 2.5053 15 52 15 1.1200 1.8533 1.1467 1.8533 0.2200 1.2387 16 60 16 0.3133 2.0533 1.7267 0.2800 0.0800 0.8907 17 63 17 0.6650 1.8530 1.1570 0.6890 0.2450 1.6800 18 MA2 Task4.csv (note that only the last row should differ from the exported matrix in Task 2): 12 2.0867 3.1467 2.9733 2.1133 3.1200 2.6880 13 2.0267 0.1933 2.2667 2.7000 2.0333 1.8440 14 3.0333 1.6333 2.5133 3.2067 2.1400 2.5053 15 1.1200 1.8533 1.1467 1.8533 0.2200 1.2387 16 0.3133 2.0533 1.7267 0.2800 0.0800 0.8907 17 0.6650 1.8530 1.1570 0.6890 0.2450 1.6800 18 0.4323 1.2045 0.7521 0.4478 0.1593 1.0920 10
Step by Step Solution
There are 3 Steps involved in it

Get step-by-step solutions from verified subject matter experts