

Question: I need help with stat homework V The scatter FM shows the time spent studying, x, and the quiz score, y, for each of 25
I need help with stat homework
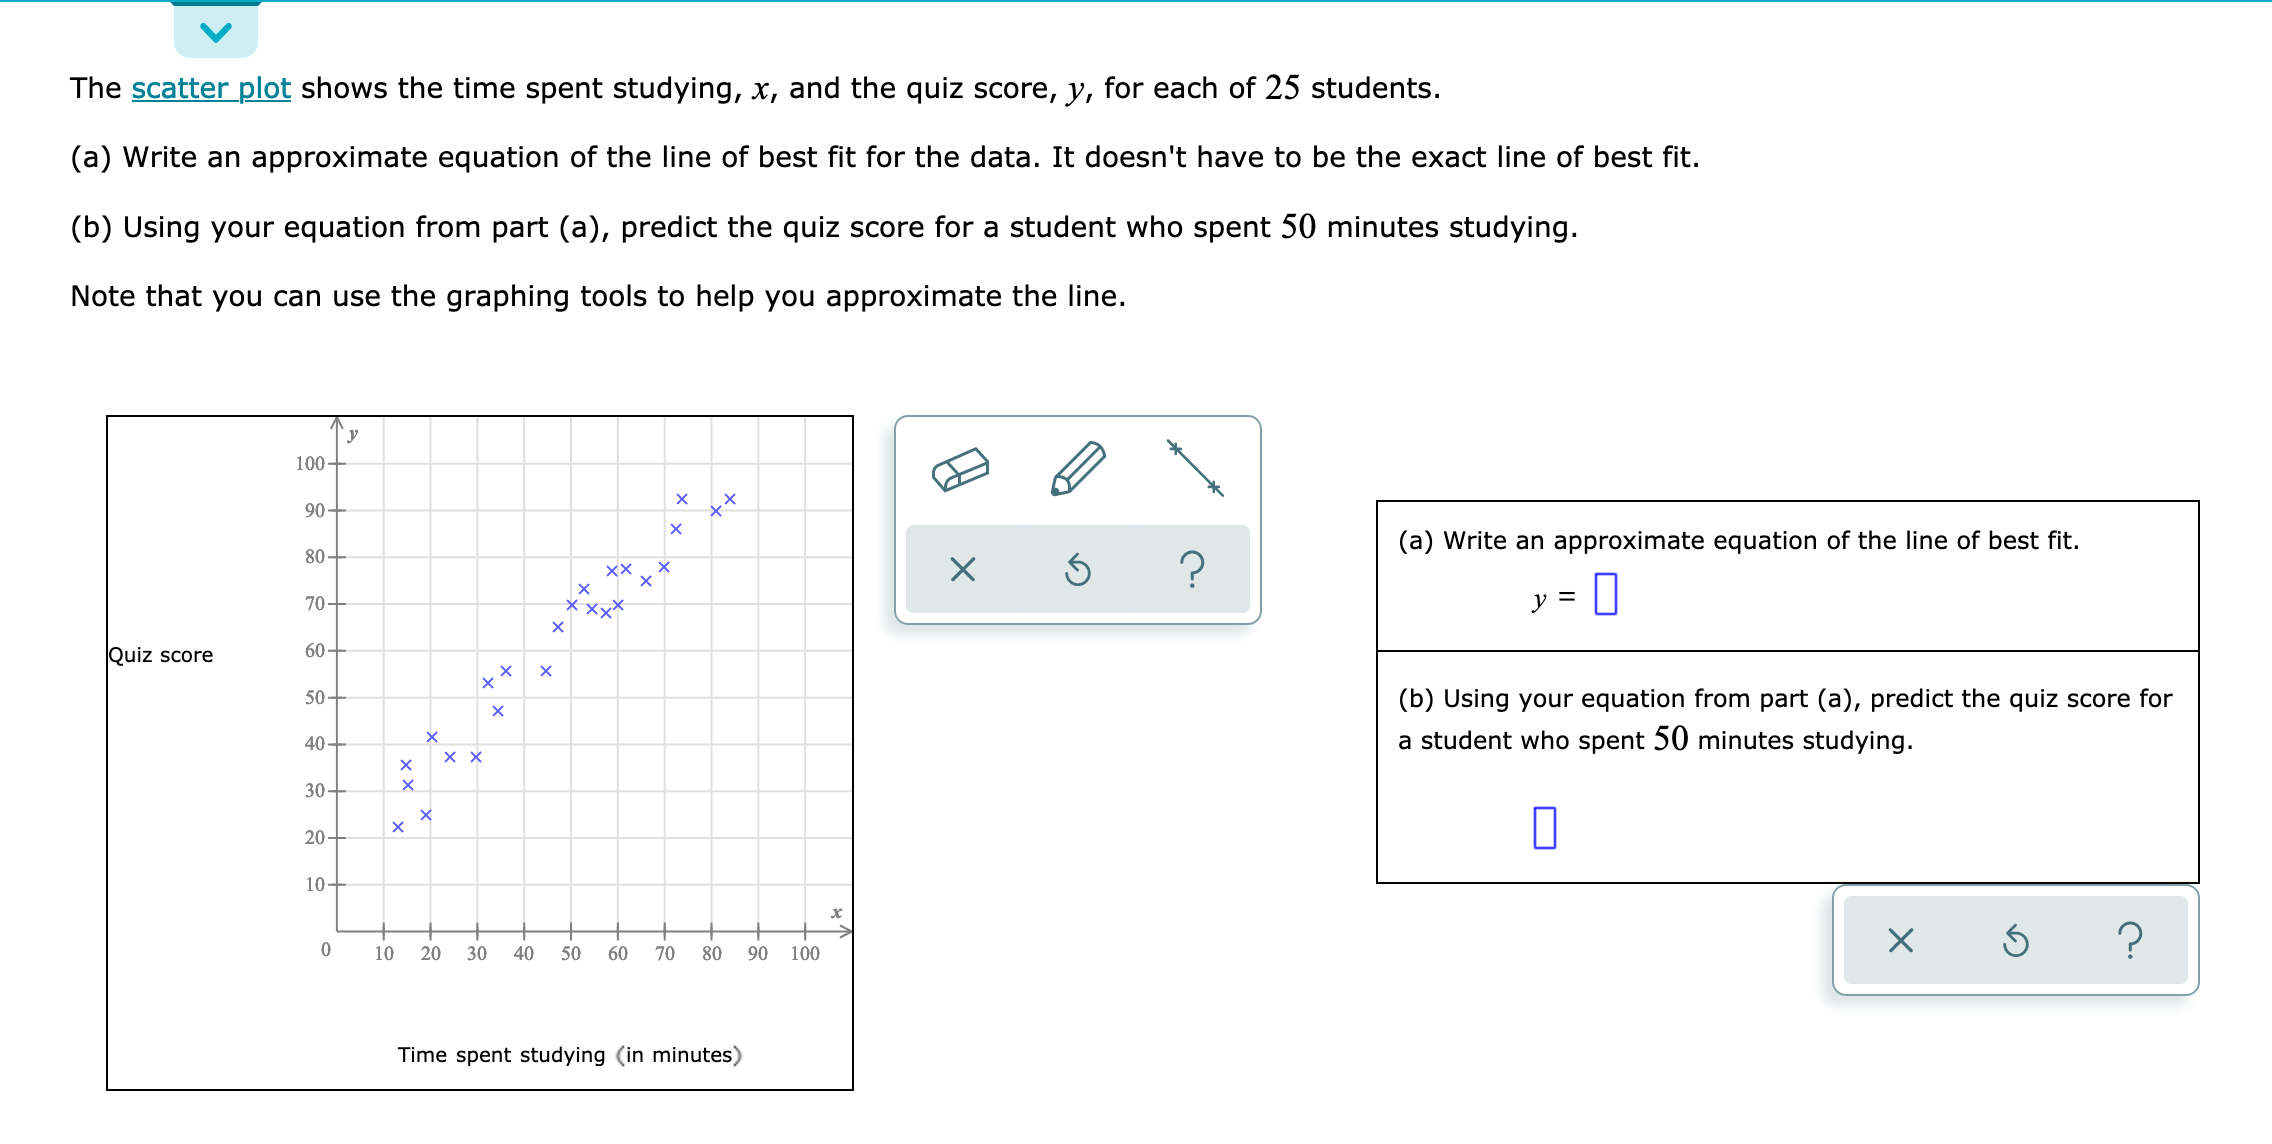
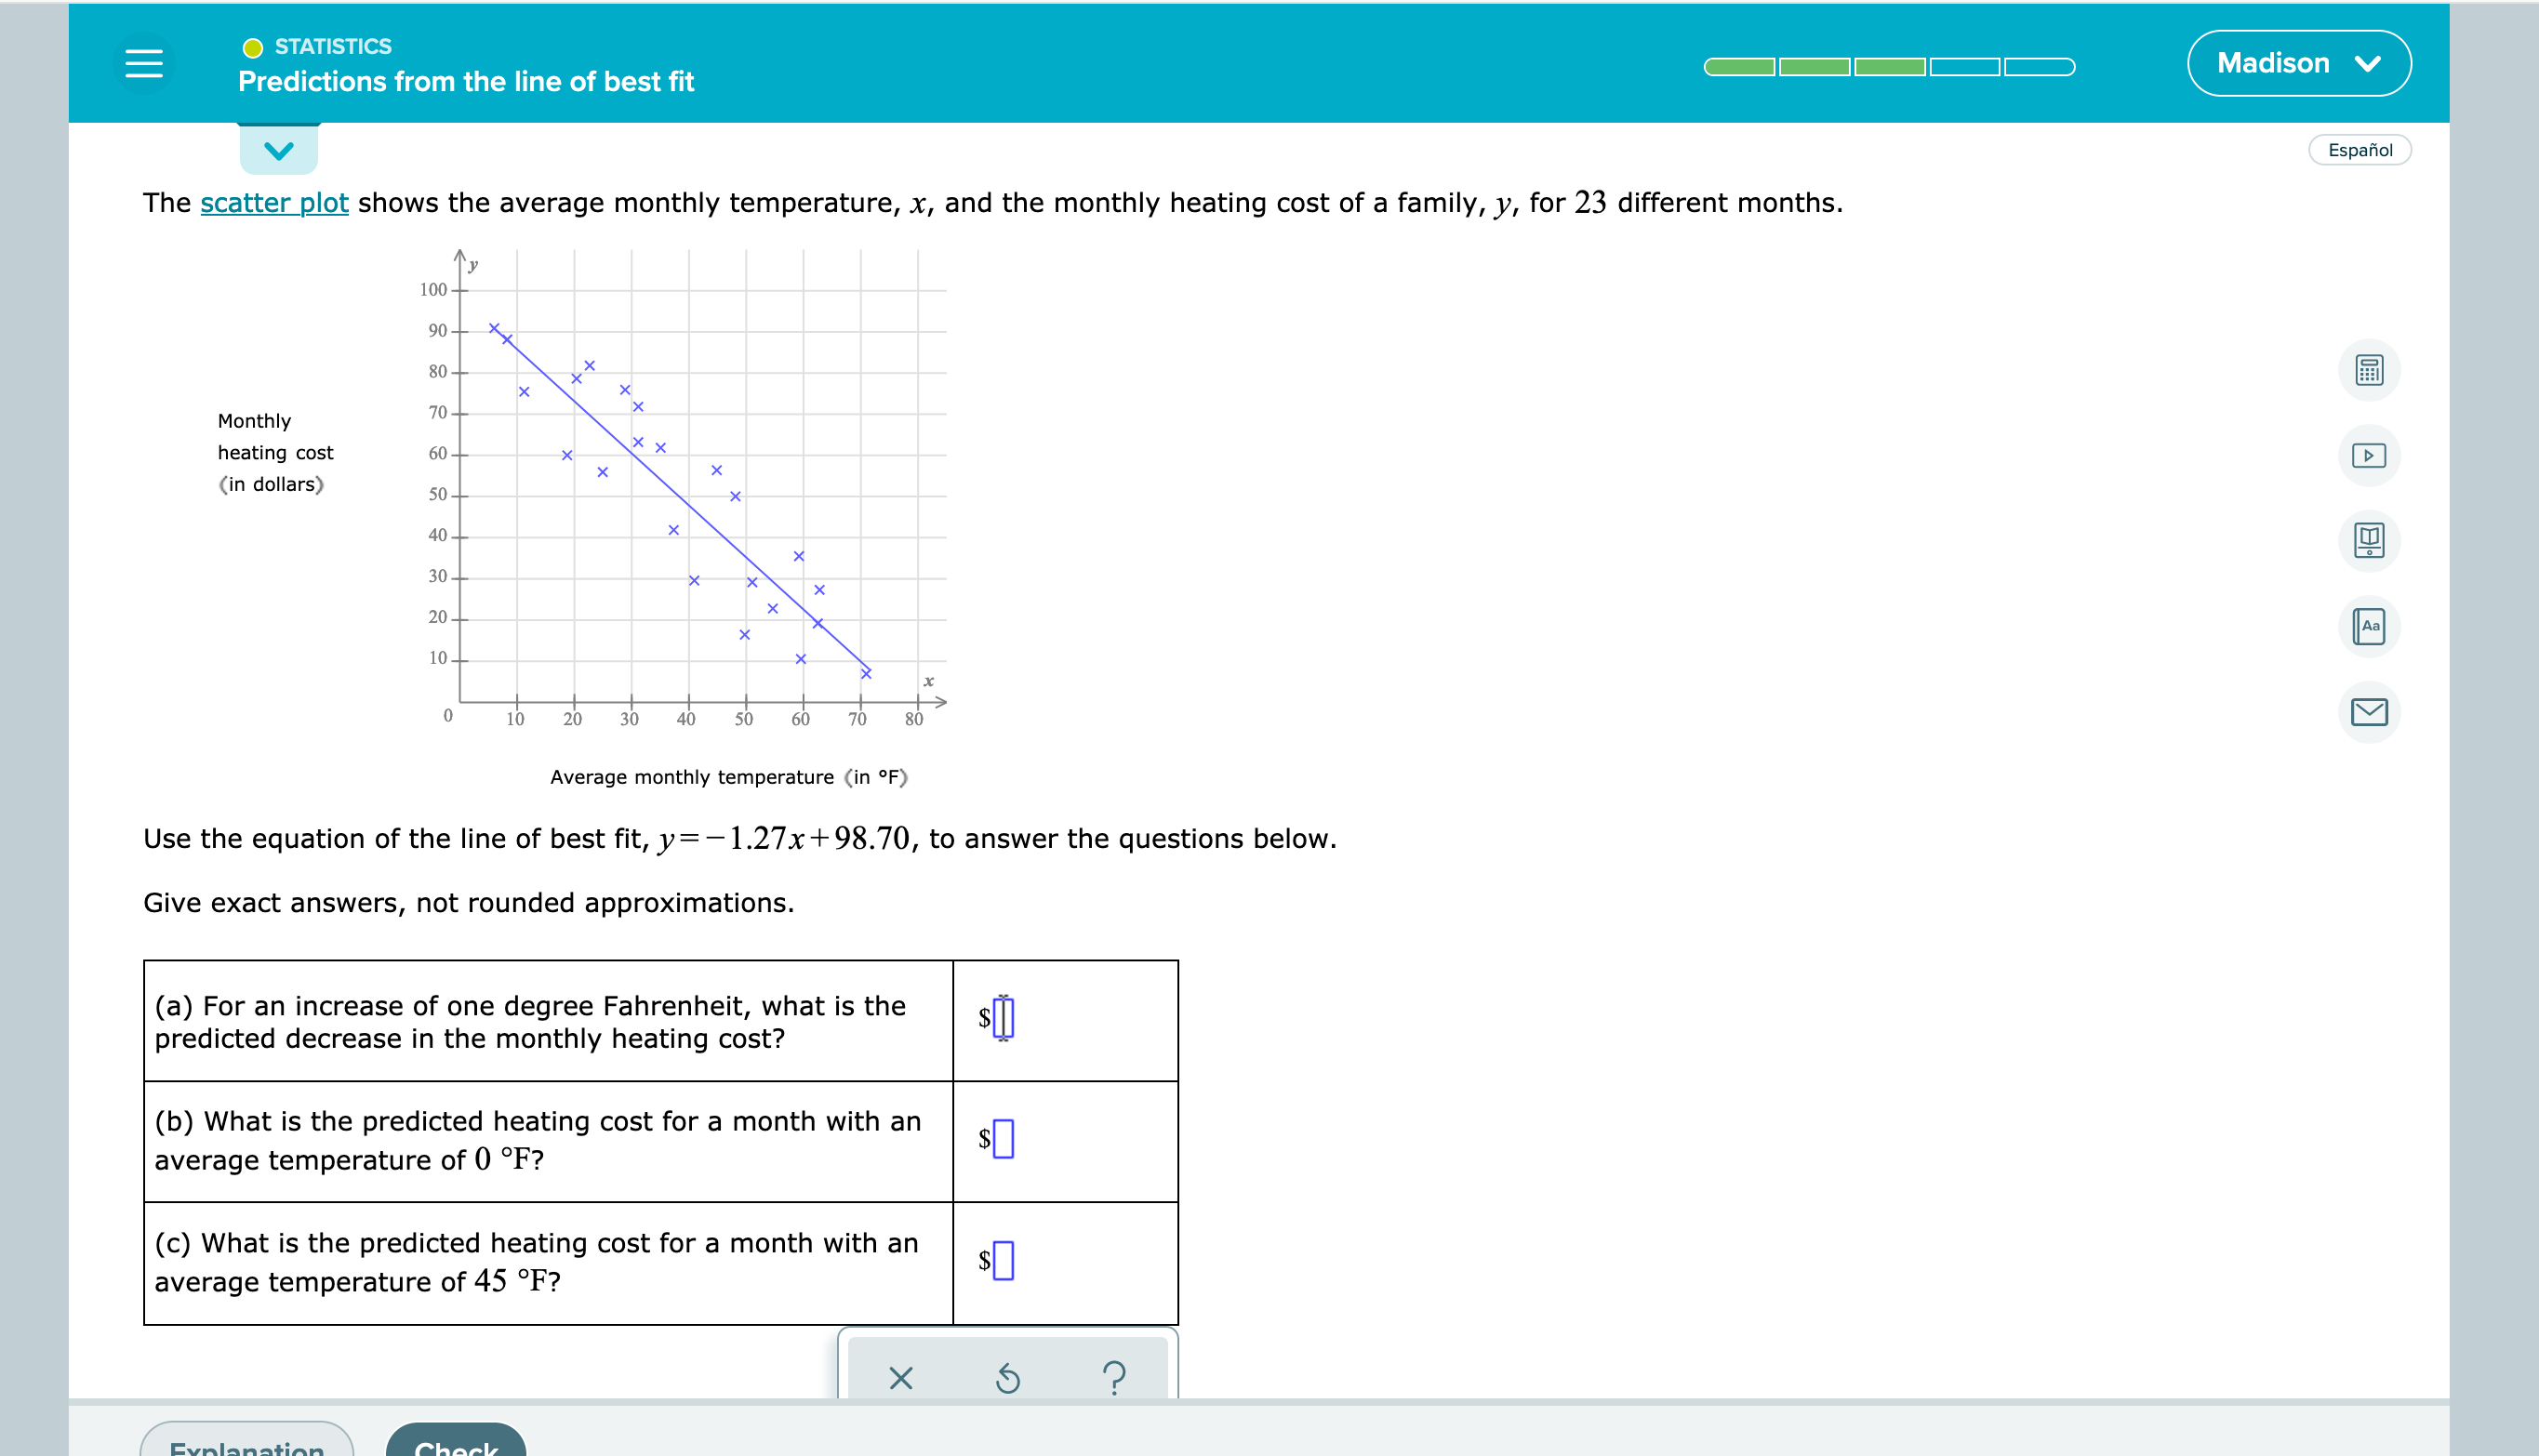
V The scatter FM shows the time spent studying, x, and the quiz score, y, for each of 25 students. (a) Write an approximate equation of the line of best t for the data. It doesn't have to be the exact line of best t. (b) Using your equation from part (a), predict the quiz score for a student who spent 50 minutes studying. Note that you can use the graphing tools to help you approximate the line. (a) Write an approximate equation of the line of best t. y=D (b) Using your equation from part (a), predict the quiz score for a student who spent 50 minutes studying. I] x I I | I I I l I I I 0 10 20 30 40 50 60 70 80 90 100 Time spent studying (in minutes) o STATISTICS / _ '\\ v ' Predictions from the line of best fit K MadlSOl'l ,/ V The scatter plot shows the average monthly temperature, x, and the monthly heating cost of a family, y, for 23 different months. Monthly heating cost (in dollars) 10 20 30 Average monthly temperature (In F) Use the equation of the line of best t, y= -1.27x+98.70, to answer the questions below. Give exact answers, not rounded approximations. (a) For an increase of one degree Fahrenheit, what is the predicted decrease in the monthly heating cost? (b) What is the predicted heating cost for a month with an average temperature of 0 F? (c) What is the predicted heating cost for a month with an average temperature of 45 F? / momma-.. \\ m
Step by Step Solution
There are 3 Steps involved in it

Get step-by-step solutions from verified subject matter experts