

Question: I need help with the below question : 2.29. Consider the following sequence of changes in the demand and supply for cab service in some
I need help with the below question :
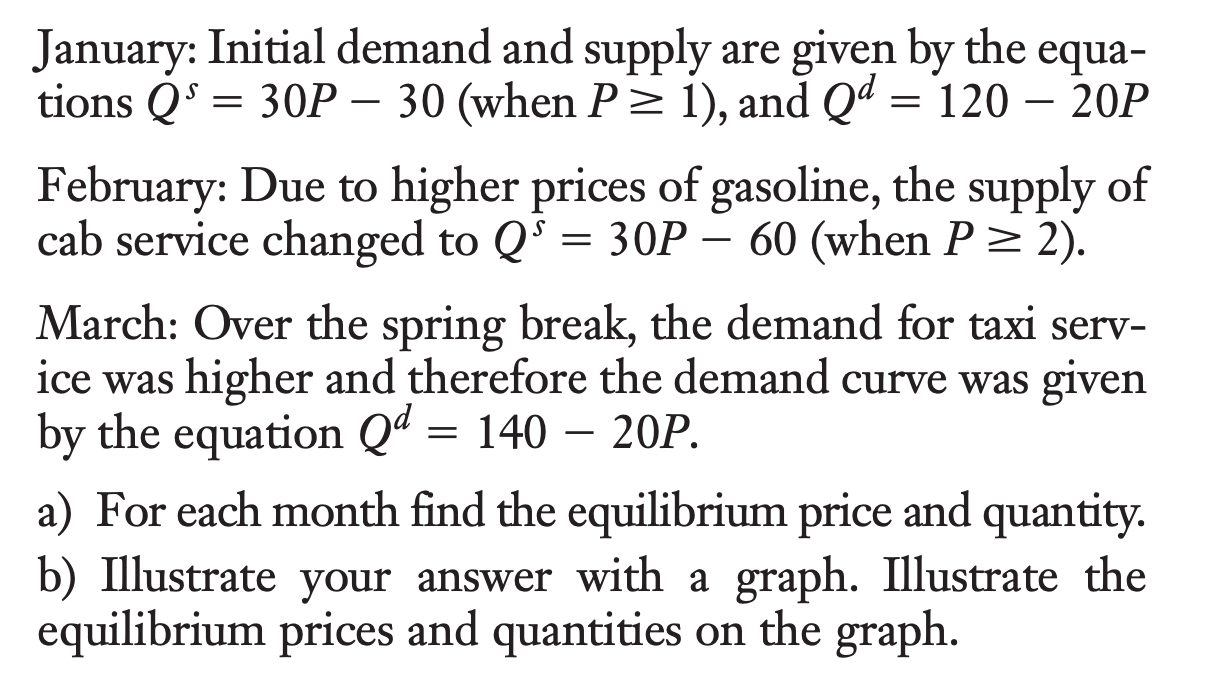
2.29. Consider the following sequence of changes in the demand and supply for cab service in some city. The price P is a price per mile, while quantity is the total length of cab rides over a month (in thousands of miles). January: Initial demand and supply are given by the equa- tions QF = 30P 30 (when P = 1),and Q = 120 20P February: Due to higher prices of gasoline, the supply of cab service changed to Q = 30P 60 (when P = 2). March: Over the spring break, the demand for taxi serv- ice was higher and therefore the demand curve was given by the equation Q = 140 20P. a) For each month find the equilibrium price and quantity. b) Illustrate your answer with a graph. Illustrate the equilibrium prices and quantities on the graph
Step by Step Solution
There are 3 Steps involved in it

Get step-by-step solutions from verified subject matter experts