

Question: i need help with the calculations, excel data provided. thank you Calculations: Using the relationship given, obtain the friction factor for each pipe, calculate Re
 i need help with the calculations, excel data provided. thank you
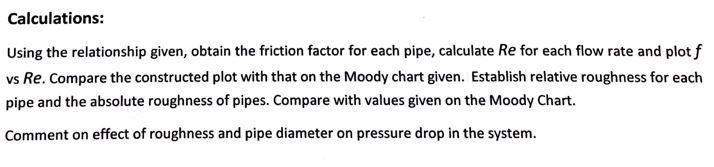
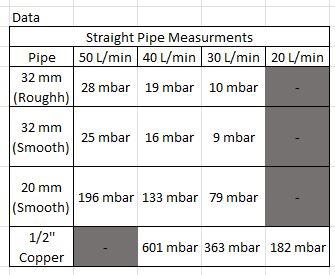
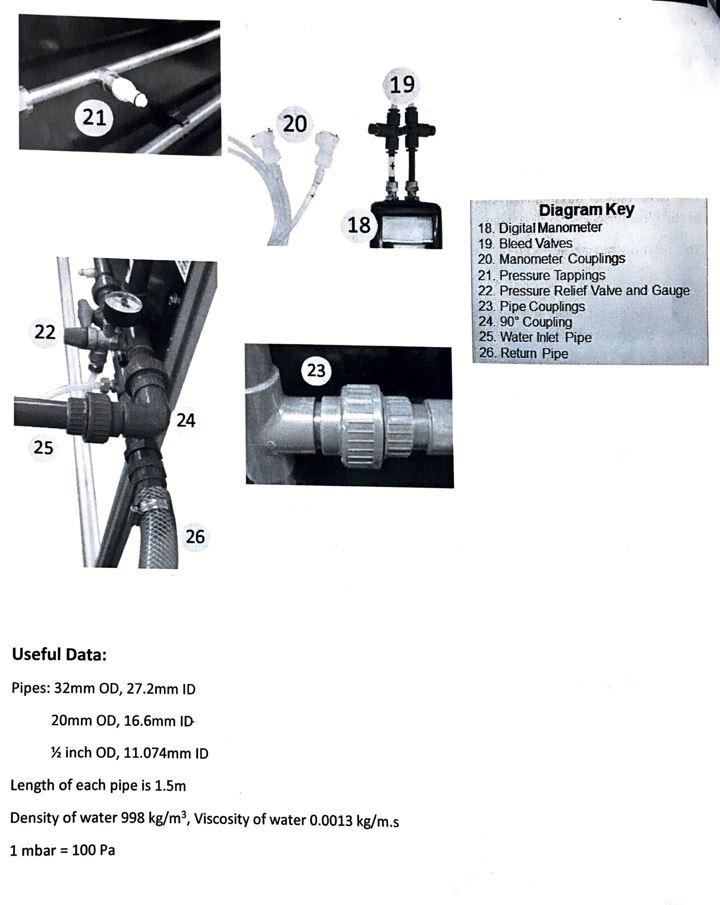
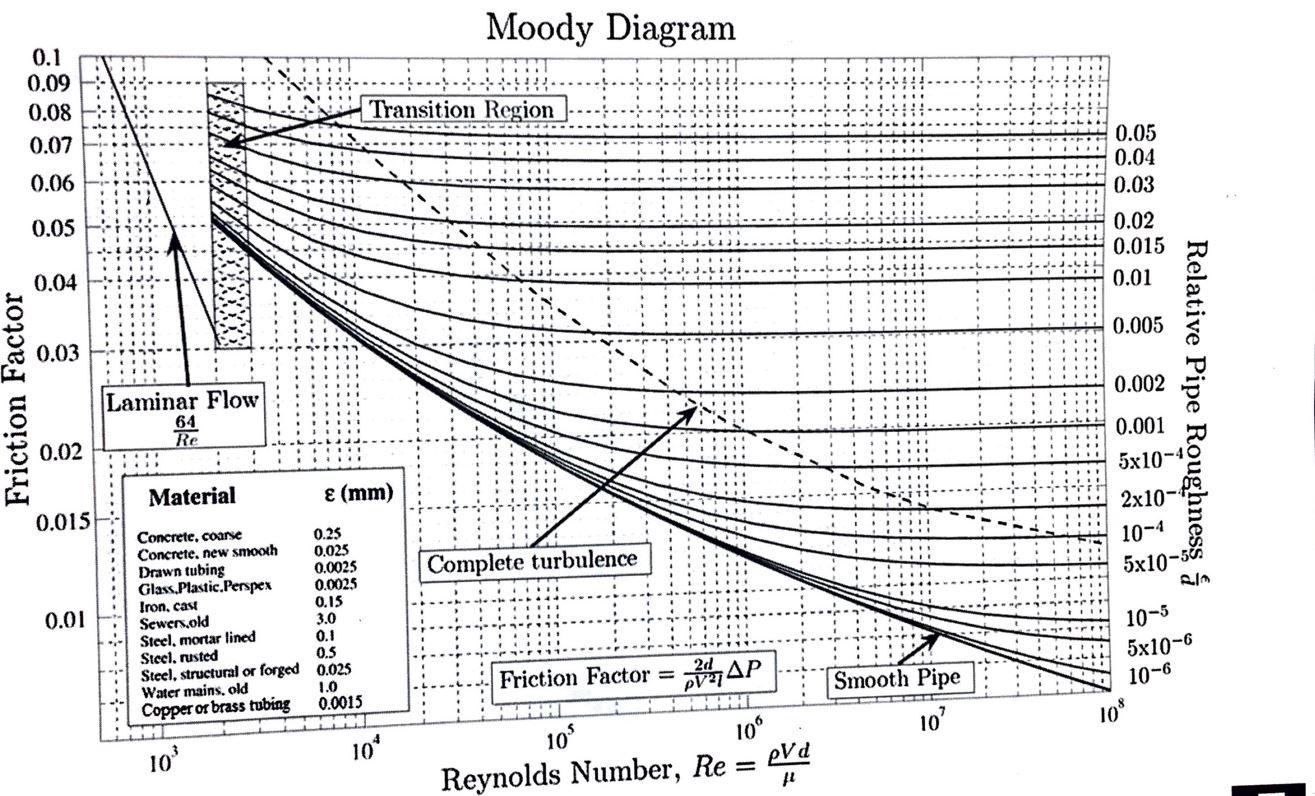
Calculations: Using the relationship given, obtain the friction factor for each pipe, calculate Re for each flow rate and plotf vs Re. Compare the constructed plot with that on the Moody chart given. Establish relative roughness for each pipe and the absolute roughness of pipes. Compare with values given on the Moody Chart. Comment on effect of roughness and pipe diameter on pressure drop in the system. Data Straight Pipe Measurments Pipe 50 L/min 40 L/min 30 L/min 20 L/min 32 mm 28 mbar 19 mbar 10 mbar (Roughh) 32 mm 25 mbar 16 mbar 9 mbar (Smooth) 20 mm (Smooth) 196 mbar 133 mbar 79 mbar 1/2" Copper 601 mbar 363 mbar 182 mbar 19 21 20 # 18 Diagram Key 18. Digital Manometer 19. Bleed Valves 20. Manometer Couplings 21. Pressure Tappings 22 Pressure Relief Valve and Gauge 23. Pipe Couplings 24. 90Coupling 25. Water Inlet Pipe 26. Return Pipe 22 23 24 25 26 Useful Data: Pipes: 32mm OD, 27.2mm ID 20mm OD, 16.6mm ID inch OD, 11.074mm ID Length of each pipe is 1.5m Density of water 998 kg/m, Viscosity of water 0.0013 kg/m.s 1 mbar = 100 Pa Determination of Pressure Losses in Straight Pipes Frictional losses in a fluid as represented by pressure drop may be expressed by the following equation: AP = f(L.p.V2/2D) Where f is the friction factor, V the linear velocity of flow, L the length of pipe and D is the pipe diameter. The friction factor has been correlated with two properties of the piping system: Reynolds number & roughness of the pipe surface. This relationship is presented on the Moody Chart (attached). The objectives of this exercise are: To determine the friction factor at various flow rates, obtain the roughness of pipes and compare them with published values. To plot the data to compare how closely the experimental data agrees with the given chart. To observe and comment on the effects of pipe surface roughness and pipe diameter on pressure drop within a system, which are important in the design of process piping systems 15 3 fazo 5 10 DI 11 12 16 13 16 Diagram Key 1. Water Inlet 11. 20mm PVC Pipe 2. Water Outlet 12. 32mm Rough PVC Pipe 3. Optional Modules Section 13. 32mm Smooth PVC Pipe Sudden Expansion 14. Back Pressure Control Valve 4. 90 Elbow 15. Section Isolating Valves 5. Parallel Pipes 16. Frame Mounting Points 6. 45 Swept Tee 17. Horizontal Support Member 7. Long Radius Elbow 18. Lockable Castor Wheels 8. Short Radius Elbow 9. Sudden Constriction 10. " Copper Pipe 17 18 18 Moody Diagram 0.1 0.09 0.08 0.07 Transition Region 0.06 0.05 0.04 0.03 0.02 0.015 0.01 0.05 0.04 0.005 0.03 0.002 Friction Factor Laminar Flow 64 Re Relative Pipe Roughness 0.02 0.001 5x10⁻⁴ Material (mm) 2x10⁻⁴ 0.015 10-4 Complete turbulence 5x10-50 0.01 Concrete, coarse 0.25 Concrete, new smooth 0.025 Drawn tubing 0.0025 Glass, Plastic Perspex 0.0025 Iron, cast 0.15 Sewers old 3.0 Steel, mortar lined 0.1 Stect, rusted 0.5 Steel, structural or forged 0.025 Water mains, old 1.0 Copper or brass tubing 0.0015 10-5 Friction Factor = PAP Smooth Pipe 10 5x10⁻⁶ 10-6 10% 10 10 10* 10 Reynolds Number, Re evd Calculations: Using the relationship given, obtain the friction factor for each pipe, calculate Re for each flow rate and plotf vs Re. Compare the constructed plot with that on the Moody chart given. Establish relative roughness for each pipe and the absolute roughness of pipes. Compare with values given on the Moody Chart. Comment on effect of roughness and pipe diameter on pressure drop in the system. Data Straight Pipe Measurments Pipe 50 L/min 40 L/min 30 L/min 20 L/min 32 mm 28 mbar 19 mbar 10 mbar (Roughh) 32 mm 25 mbar 16 mbar 9 mbar (Smooth) 20 mm (Smooth) 196 mbar 133 mbar 79 mbar 1/2" Copper 601 mbar 363 mbar 182 mbar 19 21 20 # 18 Diagram Key 18. Digital Manometer 19. Bleed Valves 20. Manometer Couplings 21. Pressure Tappings 22 Pressure Relief Valve and Gauge 23. Pipe Couplings 24. 90Coupling 25. Water Inlet Pipe 26. Return Pipe 22 23 24 25 26 Useful Data: Pipes: 32mm OD, 27.2mm ID 20mm OD, 16.6mm ID inch OD, 11.074mm ID Length of each pipe is 1.5m Density of water 998 kg/m, Viscosity of water 0.0013 kg/m.s 1 mbar = 100 Pa Determination of Pressure Losses in Straight Pipes Frictional losses in a fluid as represented by pressure drop may be expressed by the following equation: AP = f(L.p.V2/2D) Where f is the friction factor, V the linear velocity of flow, L the length of pipe and D is the pipe diameter. The friction factor has been correlated with two properties of the piping system: Reynolds number & roughness of the pipe surface. This relationship is presented on the Moody Chart (attached). The objectives of this exercise are: To determine the friction factor at various flow rates, obtain the roughness of pipes and compare them with published values. To plot the data to compare how closely the experimental data agrees with the given chart. To observe and comment on the effects of pipe surface roughness and pipe diameter on pressure drop within a system, which are important in the design of process piping systems 15 3 fazo 5 10 DI 11 12 16 13 16 Diagram Key 1. Water Inlet 11. 20mm PVC Pipe 2. Water Outlet 12. 32mm Rough PVC Pipe 3. Optional Modules Section 13. 32mm Smooth PVC Pipe Sudden Expansion 14. Back Pressure Control Valve 4. 90 Elbow 15. Section Isolating Valves 5. Parallel Pipes 16. Frame Mounting Points 6. 45 Swept Tee 17. Horizontal Support Member 7. Long Radius Elbow 18. Lockable Castor Wheels 8. Short Radius Elbow 9. Sudden Constriction 10. " Copper Pipe 17 18 18 Moody Diagram 0.1 0.09 0.08 0.07 Transition Region 0.06 0.05 0.04 0.03 0.02 0.015 0.01 0.05 0.04 0.005 0.03 0.002 Friction Factor Laminar Flow 64 Re Relative Pipe Roughness 0.02 0.001 5x10⁻⁴ Material (mm) 2x10⁻⁴ 0.015 10-4 Complete turbulence 5x10-50 0.01 Concrete, coarse 0.25 Concrete, new smooth 0.025 Drawn tubing 0.0025 Glass, Plastic Perspex 0.0025 Iron, cast 0.15 Sewers old 3.0 Steel, mortar lined 0.1 Stect, rusted 0.5 Steel, structural or forged 0.025 Water mains, old 1.0 Copper or brass tubing 0.0015 10-5 Friction Factor = PAP Smooth Pipe 10 5x10⁻⁶ 10-6 10% 10 10 10* 10 Reynolds Number, Re evd
Step by Step Solution
There are 3 Steps involved in it

Get step-by-step solutions from verified subject matter experts