

Question: I need help with the excel formulas ! 39 40 d. Graph the cost of debt versus the face value of debt for values of
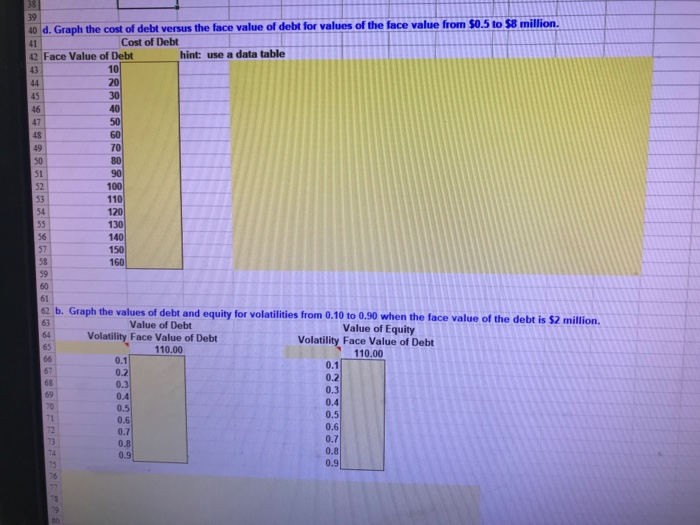
39 40 d. Graph the cost of debt versus the face value of debt for values of the face value from $0.5 to $8 million. Cost of Debt hint: use a data table 2 Face Value of Debt 43 10 20 46 48 50 51 90 110 120 140 150 160 61 s2 b. Graph the values of debt and equity for volatilities from 0.10 to 0.90 when the face value of the debt is $2 million 63 64 Volatility Face Value of Debt Value of Debt Value of Equity Volatility Face Value of Debt 110.00 110.00 0.1 0.2 0.3 0.4 0.1 0.2 0.3 0.4 0.5 0.6 0.7 0.8 0.9 68 0.6 0.7 0.8 0.9 39 40 d. Graph the cost of debt versus the face value of debt for values of the face value from $0.5 to $8 million. Cost of Debt hint: use a data table 2 Face Value of Debt 43 10 20 46 48 50 51 90 110 120 140 150 160 61 s2 b. Graph the values of debt and equity for volatilities from 0.10 to 0.90 when the face value of the debt is $2 million 63 64 Volatility Face Value of Debt Value of Debt Value of Equity Volatility Face Value of Debt 110.00 110.00 0.1 0.2 0.3 0.4 0.1 0.2 0.3 0.4 0.5 0.6 0.7 0.8 0.9 68 0.6 0.7 0.8 0.9
Step by Step Solution
There are 3 Steps involved in it

Get step-by-step solutions from verified subject matter experts