

Question: I need help with this. don't take long please and thank you! 5. Fiscal policy, the money market, and aggregate demand Suppose there is some


I need help with this. don't take long please and thank you!
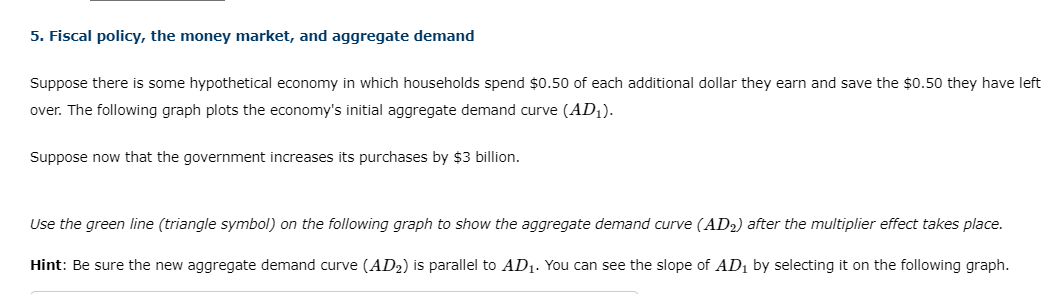
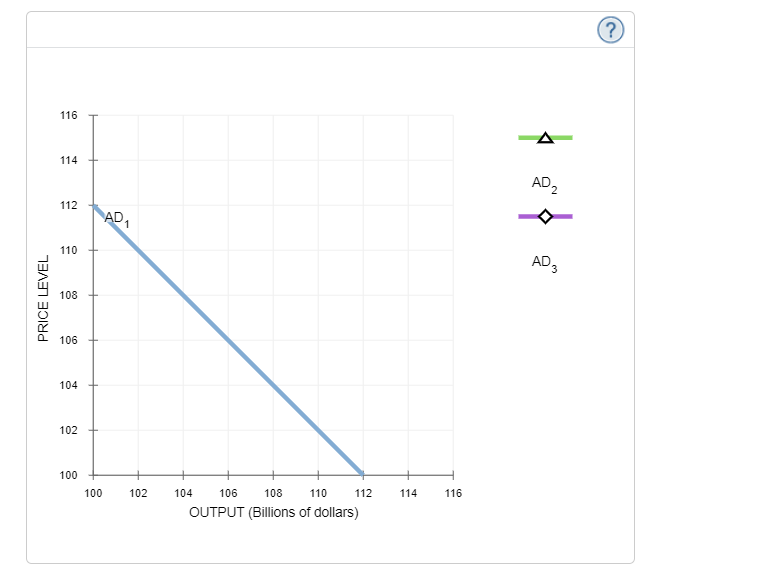


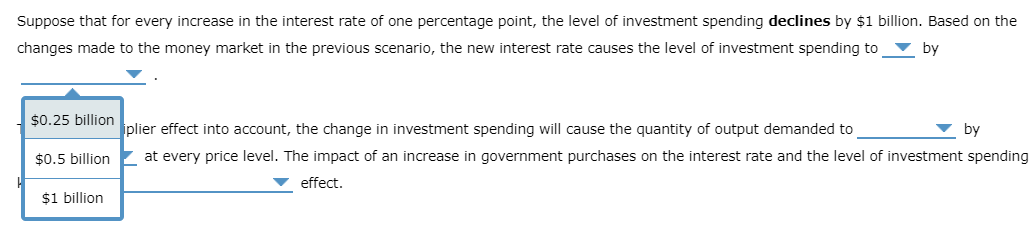


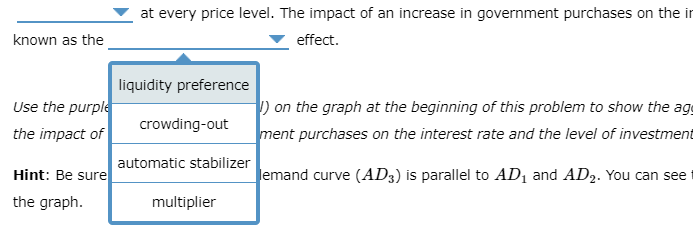


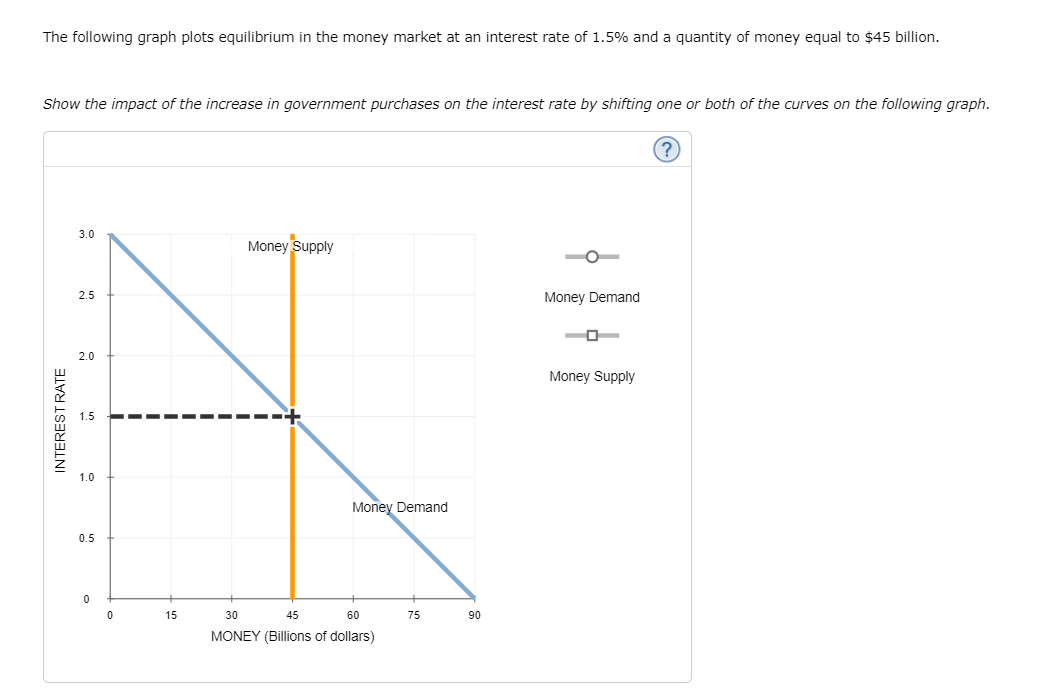
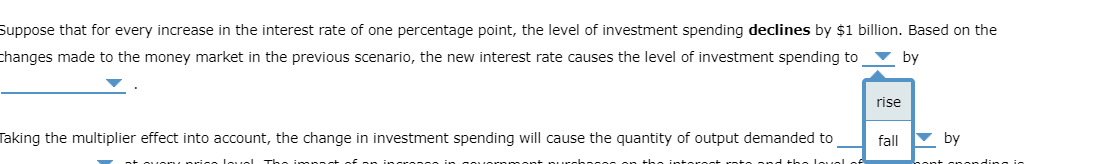
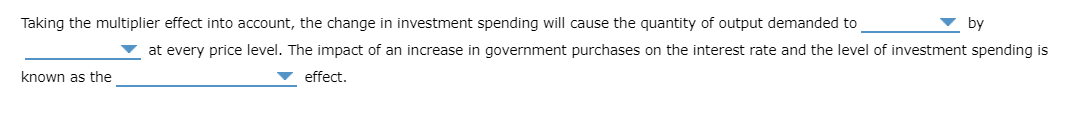
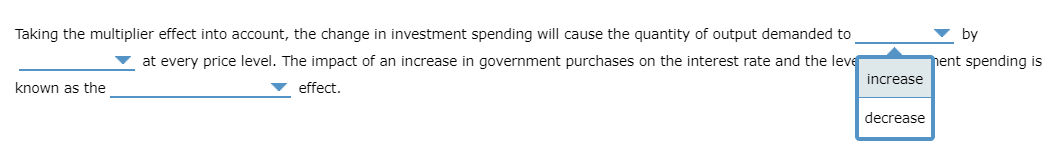
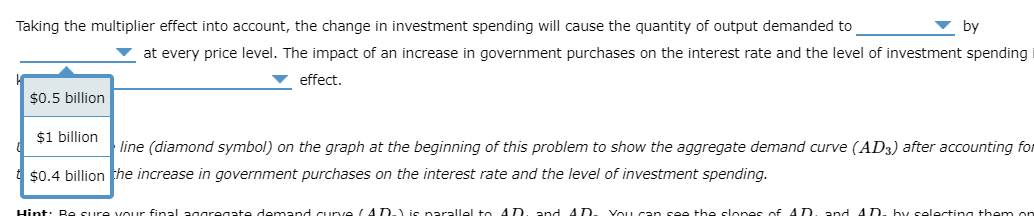
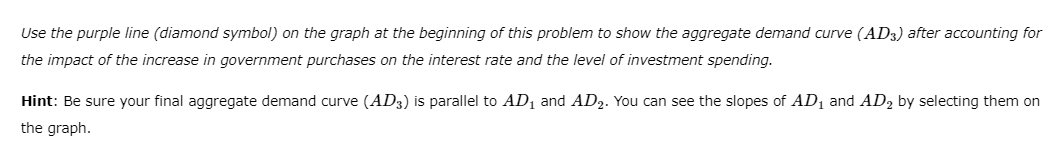
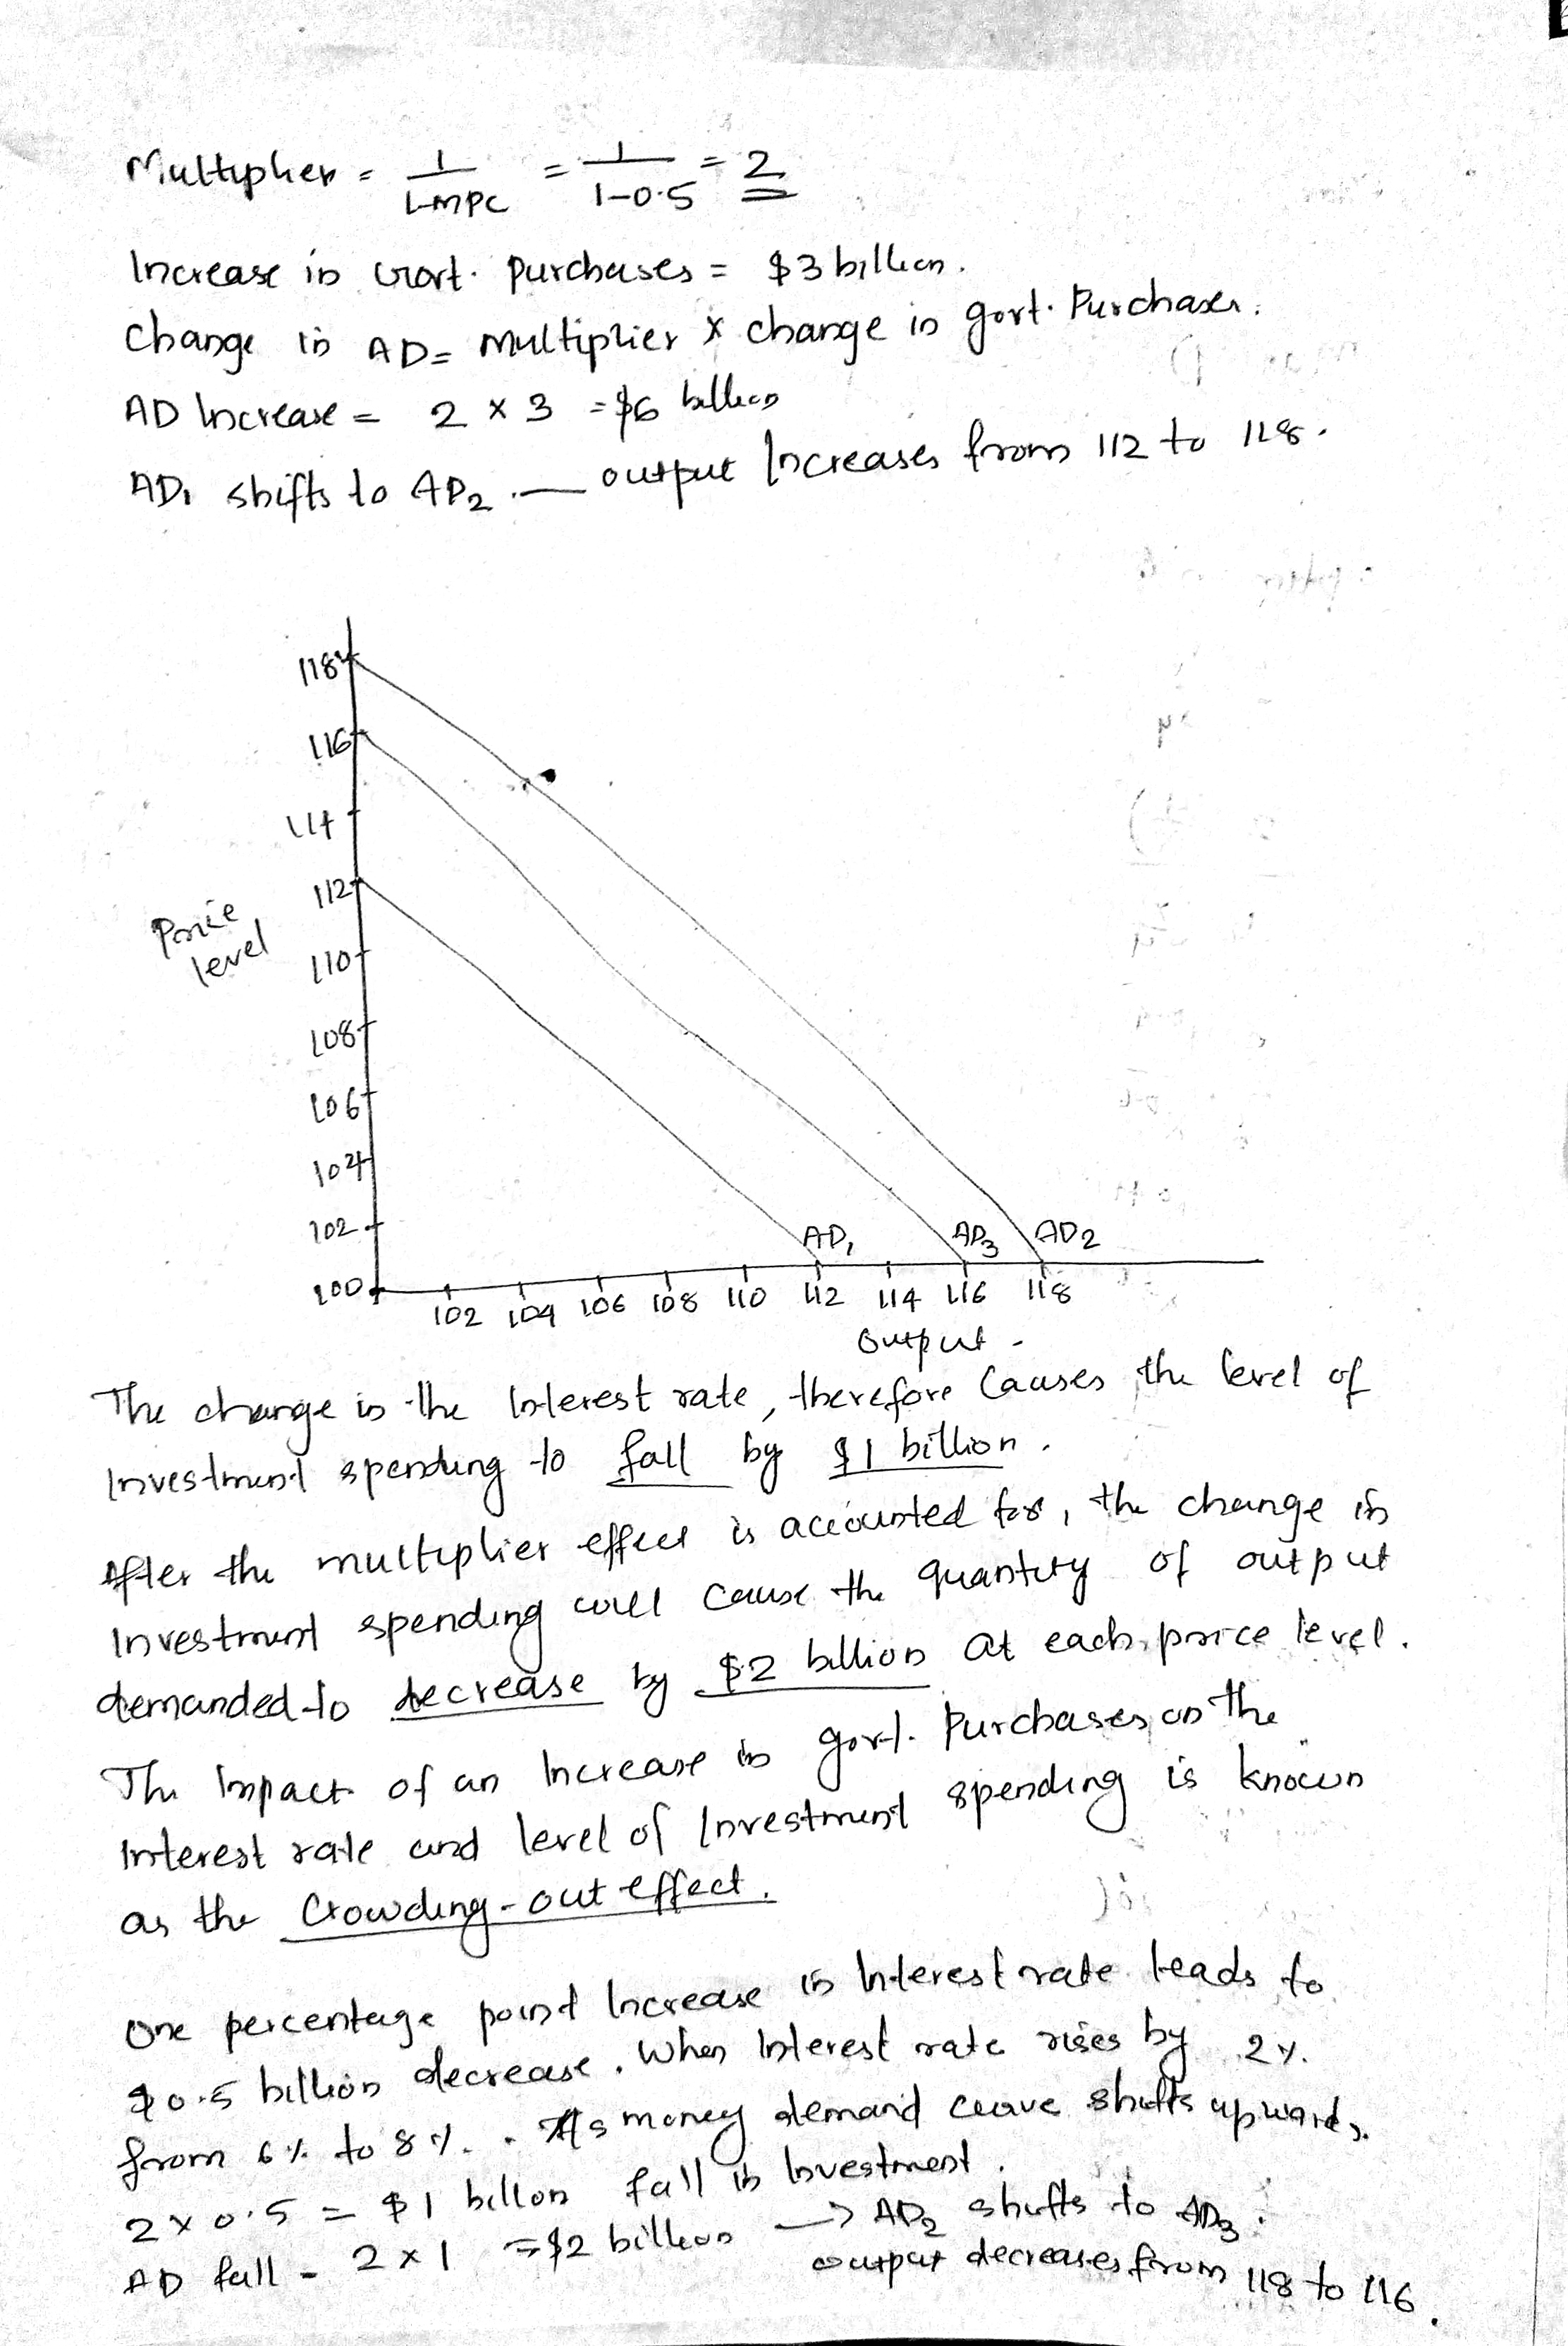
5. Fiscal policy, the money market, and aggregate demand Suppose there is some hypothetical economy in which households spend $0.50 of each additional dollar they earn and save the $0.50 they have left over. The following graph plots the economy's initial aggregate demand curve (AD,). Suppose now that the government increases its purchases by $3 billion. Use the green line (triangle symbol) on the following graph to show the aggregate demand curve ( AD,) after the multiplier effect takes place. Hint: Be sure the new aggregate demand curve (AD2) is parallel to AD1. You can see the slope of AD, by selecting it on the following graph.\fThe following graph plots equilibrium in the money market at an interest rate of 1.5% and a quantity of money equal to $45 billion. Show the impact of the increase in government purchases on the interest rate by shifting one or both of the curves on the following graph. 3.0 Money Supply O 2.5 Money Demand 2.0 Money Supply 1.5 INTEREST RATE 1.0 Money Demand 0.5 15 30 45 60 75 90 MONEY (Billions of dollars)Suppose that for every increase in the interest rate of one percentage point, the level of investment spending declines by $1 billion. Based on the changes made to the money market in the previous scenario, the new interest rate causes the level of investment spending to by rise taking the multiplier effect into account, the change in investment spending will cause the quantity of output demanded to fall bySuppose that for everyr increase in the interest rate of one percentage point, the level of investment spending declines by $1 billion. Based on the changes made to the moneyr market in the previous scenario, the new interest rate causes the level of investment spending to V by V . $025 billion plier effect into account, the change in investment spending will cause the quantity of output demanded to V by $05 billion at every price level. The impact of an increase in government purchases on the interest rate and the level of investment spending V effect. $1 billion Taking the multiplier effect into account, the change in investment spending will cause the quantity of output demanded to V by V at every pn'ce level. The impact of an increase in government purchases on the interest rate and the level of investment spending is known as the V effect. Taking the multiplier effect into account, the change in investment spending will cause the quantity of output demanded to by at every price level. The impact of an increase in government purchases on the interest rate and the leve ent spending is known as the effect. increase decreaseTaking the multiplier effect into account, the change in investment spending will cause the quantity of output demanded to by at every price level. The impact of an increase in government purchases on the interest rate and the level of investment spending effect. $0.5 billion $1 billion line (diamond symbol) on the graph at the beginning of this problem to show the aggregate demand curve (AD;) after accounting fo $0.4 billion the increase in government purchases on the interest rate and the level of investment spending.at every price level. The impact of an increase in government purchases on the ir known as the effect. liquidity preference Use the purple I) on the graph at the beginning of this problem to show the ag the impact of crowding-out ment purchases on the interest rate and the level of investment automatic stabilizer Hint: Be sure emand curve (AD;) is parallel to AD, and AD2. You can see the graph. multiplierUse the purple line (diamond symbol) on the graph at the beginning of this problem to show the aggregate demand curve (AD,) after accounting for the impact of the increase in government purchases on the interest rate and the level of investment spending. Hint: Be sure your final aggregate demand curve (AD;) is parallel to AD, and AD2. You can see the slopes of AD, and AD, by selecting them on the graph.Multipher : pe =1-05 3 Increase in cort. purchases = $3 billion. change in AD= multiplier x change in gort. Purchase. AD Increase = 2 x 3 = $6 billeco AD, shifts to AP, - output Increases from 112 to 119. 1184 LIGA . Price 1127 level 1 107 Loft 104 202 of AD, AP 2 AD 2 102 104 106 108 110 412 114 116 118 The change is the Interest rate , therefore Causes the level of Investment spending -10 fall by 9 1 billion. After the multiplier effect is accounted for , the change in Investround spending will cause the quantity of output demanded to decrease by $2 billion at each, price level . The Impact of an Increase in gorl . Purchases on the Interest rate and level of Investment spending is known as the Crowding - out effect One percentage point Increase is Interest rate leads to 8015 billion decrease . When Interest rate rises by 24. from 61 to 8 1. . As money demand curve shifts up ward,. 2x0'5 = $ 1 billon fall in Investment AD full - 2x1 $ $2 billion -> ADZ shifts to ADS aoutput decreases from 118 to 116
Step by Step Solution
There are 3 Steps involved in it

Get step-by-step solutions from verified subject matter experts