

Question: I need help with this Lean Six Sigma question: Below is the question and data: I need to validate my assumptions: Question: Data: Case Study
I need help with this Lean Six Sigma question:
Below is the question and data: I need to validate my assumptions:
Question:
Data:
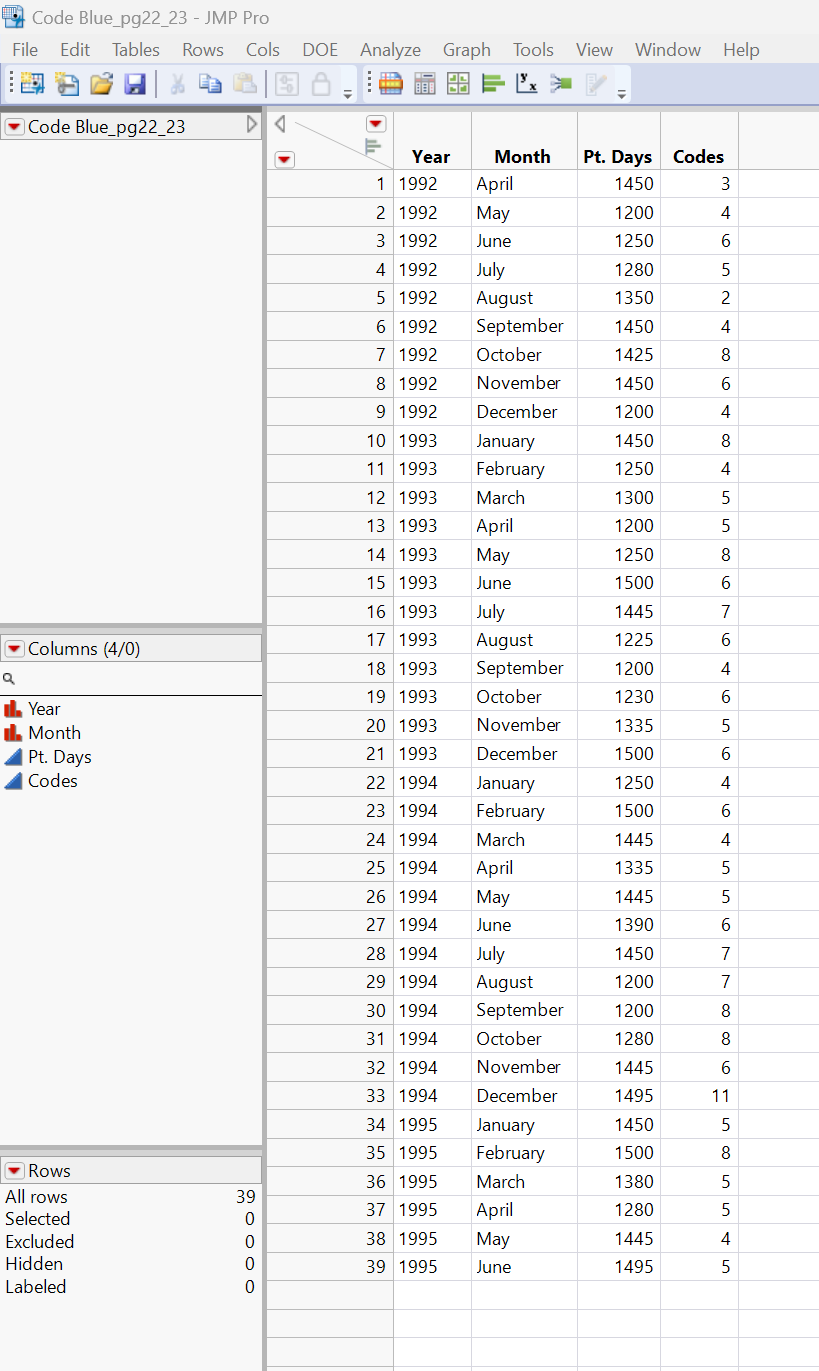
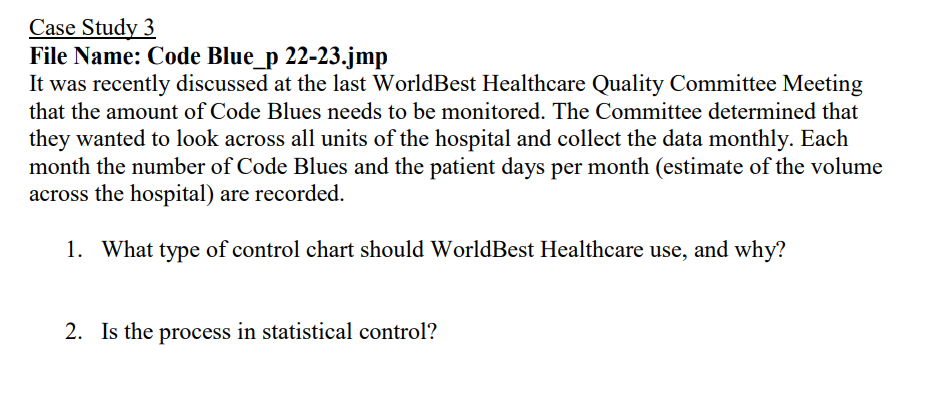
Case Study 3 File Name: Code Blue_p 22-23.jmp It was recently discussed at the last WorldBest Healthcare Quality Committee Meeting that the amount of Code Blues needs to be monitored. The Committee determined that they wanted to look across all units of the hospital and collect the data monthly. Each month the number of Code Blues and the patient days per month (estimate of the volume across the hospital) are recorded. 1. What type of control chart should WorldBest Healthcare use, and why? 2. Is the process in statistical control? Code Blue_pg22_23 - JMP Pro File Edit Tables Rows Cols DOE Analyze Graph Tools View Window Help : 0 O Code Blue_pg22_23 D 1 Year Month Pt. Days Codes 11992 April 21992 May \begin{tabular}{l|l} \hline 1450 & 3 \\ \hline 1200 & 4 \\ \hline \end{tabular} 41992 July \begin{tabular}{l|ll} 5 & 1992 August \end{tabular} 61992 September 71992 October 8 8 1992 November \begin{tabular}{l|ll} 9 & 1992 December \end{tabular} 101993 January 11 F 1993 February 121993 March 131993 April \begin{tabular}{l|l|l} 14 & 1993 May \end{tabular} 151993 June 161993 July Columns (4/0) I. Year Month Pt. Days Codes \begin{tabular}{l|l|l|} \hline 21 & 1993 & December \\ \hline 22 & 1994 & January \end{tabular} 231994 February 241994 March 251994 April \begin{tabular}{l|l|l} 26 & 1994 May \end{tabular} 271994 June \begin{tabular}{l|l} 28 & 1994 July \end{tabular} 291994 August 301994 September 311994 October 321994 November Case Study 3 File Name: Code Blue_p 22-23.jmp It was recently discussed at the last WorldBest Healthcare Quality Committee Meeting that the amount of Code Blues needs to be monitored. The Committee determined that they wanted to look across all units of the hospital and collect the data monthly. Each month the number of Code Blues and the patient days per month (estimate of the volume across the hospital) are recorded. 1. What type of control chart should WorldBest Healthcare use, and why? 2. Is the process in statistical control? Code Blue_pg22_23 - JMP Pro File Edit Tables Rows Cols DOE Analyze Graph Tools View Window Help : 0 O Code Blue_pg22_23 D 1 Year Month Pt. Days Codes 11992 April 21992 May \begin{tabular}{l|l} \hline 1450 & 3 \\ \hline 1200 & 4 \\ \hline \end{tabular} 41992 July \begin{tabular}{l|ll} 5 & 1992 August \end{tabular} 61992 September 71992 October 8 8 1992 November \begin{tabular}{l|ll} 9 & 1992 December \end{tabular} 101993 January 11 F 1993 February 121993 March 131993 April \begin{tabular}{l|l|l} 14 & 1993 May \end{tabular} 151993 June 161993 July Columns (4/0) I. Year Month Pt. Days Codes \begin{tabular}{l|l|l|} \hline 21 & 1993 & December \\ \hline 22 & 1994 & January \end{tabular} 231994 February 241994 March 251994 April \begin{tabular}{l|l|l} 26 & 1994 May \end{tabular} 271994 June \begin{tabular}{l|l} 28 & 1994 July \end{tabular} 291994 August 301994 September 311994 October 321994 November
Step by Step Solution
There are 3 Steps involved in it

Get step-by-step solutions from verified subject matter experts