

Question: I need help with this please creating a concept map of the introduction? RESEARCH ARTICLE species provide critical services to society (6), the role of
I need help with this please creating a concept map of the introduction?
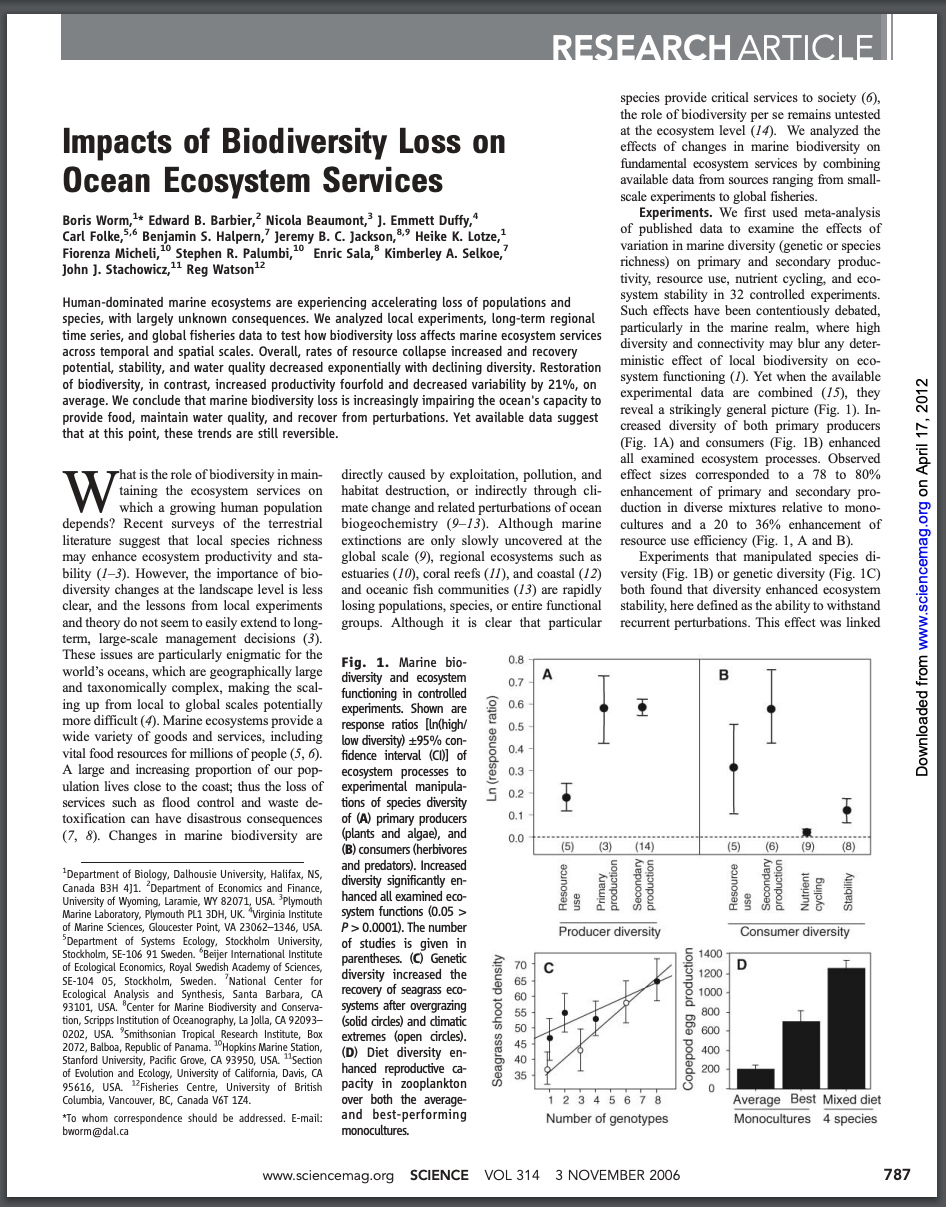
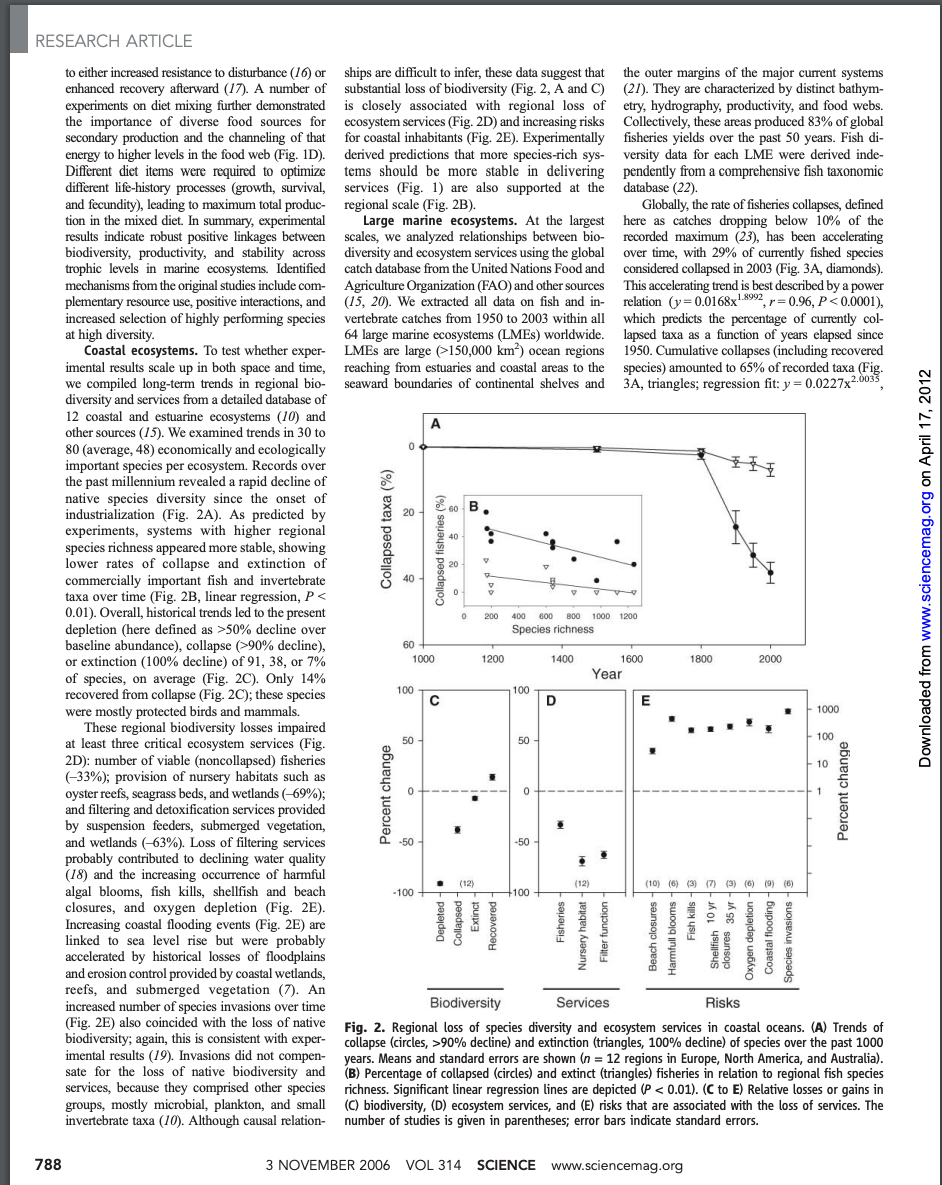
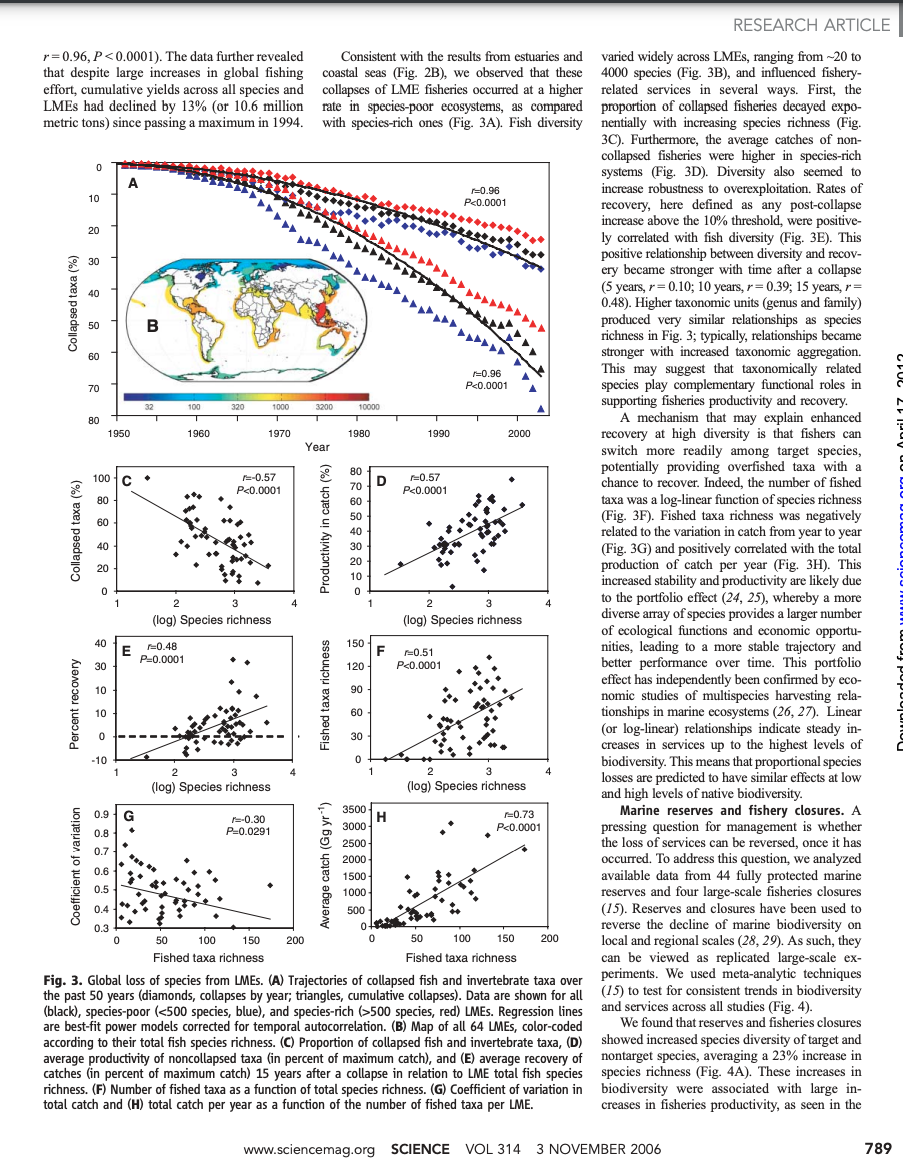
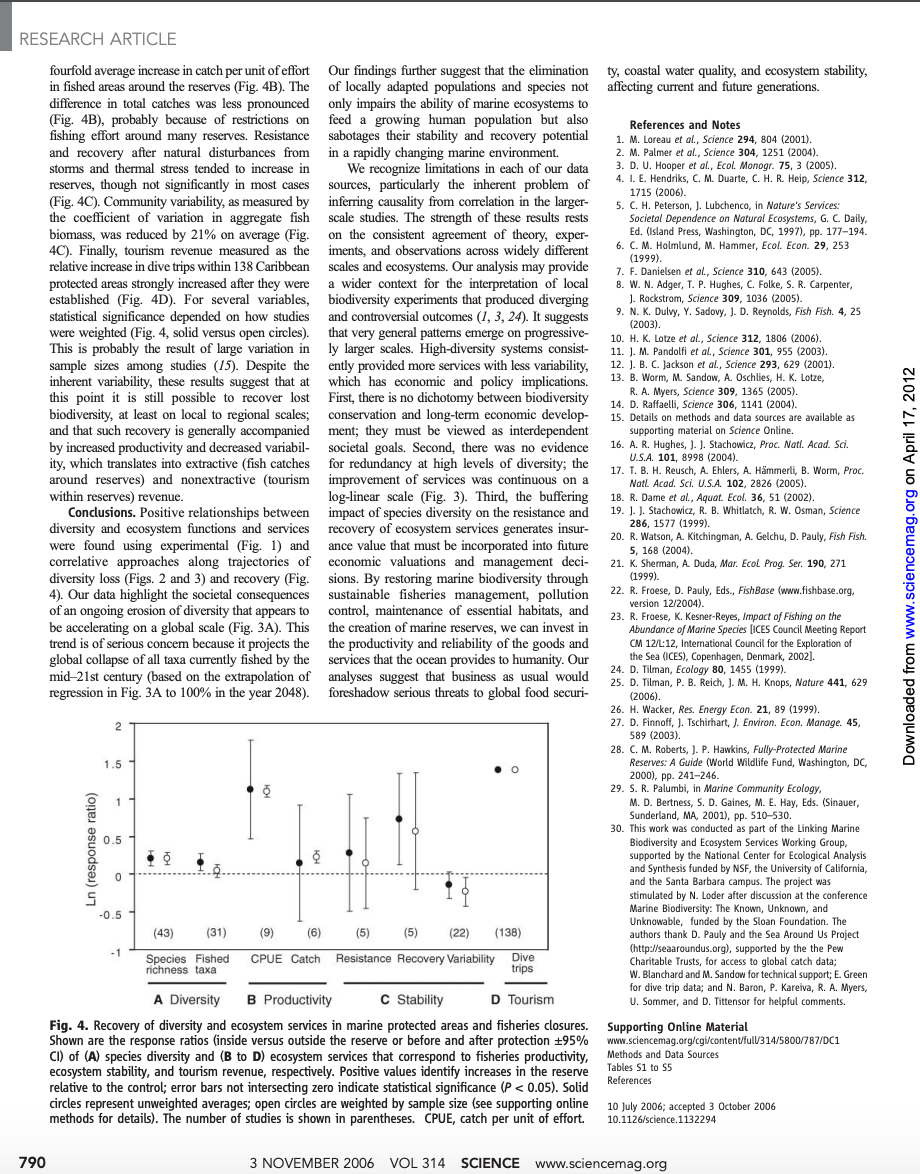
RESEARCH ARTICLE species provide critical services to society (6), the role of biodiversity per se remains untested Impacts of Biodiversity Loss on at the ecosystem level (14). We analyzed the effects of changes in marine biodiversity on fundamental ecosystem services by combining Ocean Ecosystem Services available data from sources ranging from small- scale experiments to global fisheries. Boris Worm,* Edward B. Barbier," Nicola Beaumont,' ]. Emmett Duffy,* Experiments. We first used meta-analysis Carl Folke, 5.6 Benjamin S. Halpern,' Jeremy B. C. Jackson, 39 Heike K. Lotze, of published data to examine the effects of Fiorenza Micheli,"Stephen R. Palumbi," Enric Sala," Kimberley A. Selkoe," variation in marine diversity (genetic or species John J. Stachowicz, 12 Reg Watson richness) on primary and secondary produc- tivity, resource use, nutrient cycling, and eco- Human-dominated marine ecosystems are experiencing accelerating loss of populations and system stability in 32 controlled experiments. species, with largely unknown consequences. We analyzed local experiments, long-term regional Such effects have been contentiously debated, time series, and global fisheries data to test how biodiversity loss affects marine ecosystem services particularly in the marine realm, where high across temporal and spatial scales. Overall, rates of resource collapse increased and recovery diversity and connectivity may blur any deter- potential, stability, and water quality decreased exponentially with declining diversity. Restoration ministic effect of local biodiversity on eco- of biodiversity, in contrast, increased productivity fourfold and decreased variability by 21%, on system functioning (1). Yet when the available average. We conclude that marine biodiversity loss is increasingly impairing the ocean's capacity to experimental data are combined (15), they provide food, maintain water quality, and recover from perturbations. Yet available data suggest reveal a strikingly general picture (Fig. 1). In- that at this point, these trends are still reversible. creased diversity of both primary producers (Fig. 1A) and consumers (Fig. 1B) enhanced all examined ecosystem processes. Observed W that is the role of biodiversity in main- directly caused by exploitation, pollution, and effect sizes corresponded to a 78 to 80% taining the ecosystem services on habitat destruction, or indirectly through cli- enhancement of primary and secondary pro- which a growing human population mate change and related perturbations of ocean duction in diverse mixtures relative to mono- depends? Recent surveys of the terrestrial biogeochemistry (9-13). Although marine cultures and a 20 to 36% enhancement of literature suggest that local species richness extinctions are only slowly uncovered at the resource use efficiency (Fig. 1, A and B). may enhance ecosystem productivity and sta- global scale (9), regional ecosystems such as Experiments that manipulated species di- bility (1-3). However, the importance of bio- estuaries (10), coral reefs (1/), and coastal (12) versity (Fig. 1B) or genetic diversity (Fig. 1C) Downloaded from www.sciencemag.org on April 17, 2012 diversity changes at the landscape level is less and oceanic fish communities (13) are rapidly both found that diversity enhanced ecosystem clear, and the lessons from local experiments losing populations, species, or entire functional stability, here defined as the ability to withstand and theory do not seem to easily extend to long- groups. Although it is clear that particular recurrent perturbations. This effect was linked term, large-scale management decisions (3). These issues are particularly enigmatic for the Fig. 1. Marine bio- 0.8 world's oceans, which are geographically large diversity and ecosystem 0.7 A B and taxonomically complex, making the scal- functioning in controlled ing up from local to global scales potentially experiments. Shown are 0.6 more difficult (4). Marine ecosystems provide a response ratios [In(high 0.5 wide variety of goods and services, including low diversity) +95% con- (response ratio vital food resources for millions of people (5, 6). fidence interval (CI)] of 0.4 A large and increasing proportion of our pop- ecosystem processes to 0.3 ulation lives close to the coast; thus the loss of experimental manipula 5 0.2 T services such as flood control and waste de- tions of species diversity toxification can have disastrous consequences of (A) primary producers 0.1 (7, 8). Changes in marine biodiversity are (plants and algae), and B) consumers (herbivores (5 (3) (14) (5) (6) 19 (8) Department of Biology, Dalhousie University, Halifax, N5, and predators). Increased Secondary production Canada B3H 4]1. "Department of Economics and Finance, diversity significantly en- Secondary production production Resource Resource Primary Stability University of Wyoming, Laramie, WY 82071, USA. 'Plymouth hanced all examined eco- cycling Nutrient use USE Marine Laboratory, Plymouth PL1 3DH, UK. "Virginia Institute system functions (0.05 > of Marine Sciences, Gloucester Point, VA 23062-1346, USA. P > 0.0001). The number Producer diversity Consumer diversity "Department of Systems Ecology, Stockholm University, of studies is given in Stockholm, SE-106 91 Sweden. "Beijer International Institute 1400 of Ecological Economics, Royal Swedish Academy of Sciences, parentheses. (C) Genetic 70 C D SE-104 05, Stockholm, Sweden. 'National Center for diversity increased the recovery of seagrass eco 65 1200 Ecological Analysis and Synthesis, Santa Barbara, 60 1000 93101, USA. "Center for Marine Biodiversity and Conserva- systems after overgrazing tion, Scripps Institution of Oceanography, La Jolla, CA 92093- (solid circles) and climatic 55 800 Seagrass shoot density Copepod egg production 0202, USA. 'Smithsonian Tropical Research Institute, Box extremes (open circles). 50 600 2072, Balboa, Republic of Panama. "Hopkins Marine Station, Stanford University, Pacific Grove, CA 93950, USA. 1 Section (D) Diet diversity en- 400 of Evolution and Ecology, University of California, Davis, CA hanced reproductive ca- 200 95616, USA. Fisheries Centre, University of British pacity in zooplankton 0 Columbia, Vancouver, BC, Canada V6T 174. over both the average- 1 2 3 4 5 6 7 8 Average Best Mixed diet *To whom correspondence should be addressed. E-mail: and best-performing Number of genotypes Monocultures 4 species bworm @dal.ca monocultures www.sciencemag.org SCIENCE VOL 314 3 NOVEMBER 2006 787RESEARCH ARTICLE to either increased resistance to disturbance (16) or ships are difficult to infer, these data suggest that the outer margins of the major current systems enhanced recovery afterward (17). A number of substantial loss of biodiversity (Fig. 2, A and C) (21). They are characterized by distinct bathym- experiments on diet mixing further demonstrated is closely associated with regional loss of etry, hydrography, productivity, and food webs. the importance of diverse food sources for ecosystem services (Fig. 2D) and increasing risks Collectively, these areas produced 83% of global secondary production and the channeling of that for coastal inhabitants (Fig. 2E). Experimentally fisheries yields over the past 50 years. Fish di- energy to higher levels in the food web (Fig. 1D). derived predictions that more species-rich sys- versity data for each LME were derived inde- Different diet items were required to optimize tems should be more stable in delivering pendently from a comprehensive fish taxonomic different life-history processes (growth, survival, services (Fig. 1) are also supported at the database (22). and fecundity), leading to maximum total produc- regional scale (Fig. 2B). Globally, the rate of fisheries collapses, defined ion in the mixed diet. In summary, experimental Large marine ecosystems. At the largest here as catches dropping below 10% of the results indicate robust positive linkages between scales, we analyzed relationships between bio- recorded maximum (23), has been accelerating biodiversity, productivity, and stability across diversity and ecosystem services using the global over time, with 29% of currently fished species trophic levels in marine ecosystems. Identified catch database from the United Nations Food and considered collapsed in 2003 (Fig. 3A, diamonds). mechanisms from the original studies include com- Agriculture Organization (FAO) and other sources This accelerating trend is best described by a power plementary resource use, positive interactions, and (15, 20). We extracted all data on fish and in- relation ()= 0.0168x , r= 0.96, P 150,000 km*) ocean regions 1950. Cumulative collapses (including recovered imental results scale up in both space and time, reaching from estuaries and coastal areas to the species) amounted to 65% of recorded taxa (Fig. we compiled long-term trends in regional bio- seaward boundaries of continental shelves and 3A, triangles; regression fit: y = 0.0227x20035 diversity and services from a detailed database of 12 coastal and estuarine ecosystems (10) and other sources (15). We examined trends in 30 to 30 (average, 48) economically and ecologically important species per ecosystem. Records over the past millennium revealed a rapid decline of native species diversity since the onset of industrialization (Fig. 2A). As predicted by 20 260 B . experiments, systems with higher regional Collapsed taxa (%) species richness appeared more stable, showing Collapsed fisheries (9 lower rates of collapse and extinction of Downloaded from www.sciencemag.org on April 17, 2012 commercially important fish and invertebrate taxa over time (Fig. 2B, linear regression, P 50% decline over Species richness baseline abundance), collapse (>90% decline), or extinction (100% decline) of 91, 38, or 7% 1000 1200 1400 1600 1800 2000 of species, on average (Fig. 2C). Only 14% Year recovered from collapse (Fig. 2C); these species 100 100 C D were mostly protected birds and mammals. 1000 These regional biodiversity losses impaired at least three critical ecosystem services (Fig. 50 50 10 2D): number of viable (noncollapsed) fisheries 10 -33%); provision of nursery habitats such as oyster reefs, seagrass beds, and wetlands (-69%); 0 Percent change Percent change and filtering and detoxification services provided by suspension feeders, submerged vegetation, and wetlands (-63%). Loss of filtering services -50 -50 probably contributed to declining water quality (18) and the increasing occurrence of harmful 12 algal blooms, fish kills, shellfish and beach 100 - +100 (10) (6) (3) (6) closures, and oxygen depletion (Fig. 2E). Fish kills - Depleted - Extinct Increasing coastal flooding events (Fig. 2E) are Collapsed Fisheries Shellfish 10 yr - 3 Recovered closures 35 yr - Coastal flooding - Oxygen depletion - Filter function Harmfull blooms - Nursery habitat Beach closures linked to sea level rise but were probably Species invasions accelerated by historical losses of floodplains and erosion control provided by coastal wetlands, reefs, and submerged vegetation (7). An increased number of species invasions over time Biodiversity Services Risks Fig. 2E) also coincided with the loss of native Fig. 2. Regional loss of species diversity and ecosystem services in coastal oceans. (A) Trends of biodiversity; again, this is consistent with exper- collapse (circles, >90% decline) and extinction (triangles, 100% decline) of species over the past 1000 imental results (19). Invasions did not compen- years. Means and standard errors are shown (n = 12 regions in Europe, North America, and Australia). sate for the loss of native biodiversity and (B) Percentage of collapsed (circles) and extinct (triangles) fisheries in relation to regional fish species services, because they comprised other species richness. Significant linear regression lines are depicted (P 500 species, red) LMEs. Regression lines and services across all studies (Fig. 4). are best-fit power models corrected for temporal autocorrelation. (B) Map of all 64 LMEs, color-coded We found that reserves and fisheries closures according to their total fish species richness. (C) Proportion of collapsed fish and invertebrate taxa, (D) showed increased species diversity of target and average productivity of noncollapsed taxa (in percent of maximum catch), and (E) average recovery of nontarget species, averaging a 23% increase in catches (in percent of maximum catch) 15 years after a collapse in relation to LME total fish species species richness (Fig. 4A). These increases in richness. (F) Number of fished taxa as a function of total species richness. (G) Coefficient of variation in biodiversity were associated with large in- total catch and (H) total catch per year as a function of the number of fished taxa per LME. creases in fisheries productivity, as seen in the www.sciencemag.org SCIENCE VOL 314 3 NOVEMBER 2006 789RESEARCH ARTICLE fourfold average increase in catch per unit of effort Our findings further suggest that the elimination ty, coastal water quality, and ecosystem stability, in fished areas around the reserves (Fig. 4B). The of locally adapted populations and species not affecting current and future generations. difference in total catches was less pronounced only impairs the ability of marine ecosystems to (Fig. 4B), probably because of restrictions on feed a growing human population but also References and Notes fishing effort around many reserves. Resistance sabotages their stability and recovery potential 1. M. Loreau et al., Science 294, 804 (2001). and recovery after natural disturbances from in a rapidly changing marine environment. 2. M. Palmer et al., Science 304, 1251 (2004). storms and thermal stress tended to increase in We recognize limitations in each of our data 3. D. U. Hooper et al., Ecol. Monogr. 75, 3 (2005). reserves, though not significantly in most cases sources, particularly the inherent problem of 4. 1. E. Hendriks, C. M. Duarte, C. H. R. Help, Science 312, 1715 (2006). (Fig. 4C). Community variability, as measured by inferring causality from correlation in the larger- 5. C. H. Peterson, J. Lubchenco, in Nature's Services: the coefficient of variation in aggregate fish scale studies. The strength of these results rests Societal Dependence on Natural Ecosystems, G. C. Daily, biomass, was reduced by 21% on average (Fig. on the consistent agreement of theory, exper- Ed. (Island Press, Washington, DC, 1997), pp. 177-194. 4C). Finally, tourism revenue measured as the iments, and observations across widely different 6. C. M. Holmlund, M. Hammer, Ecol. Econ. 29, 253 (1999). relative increase in dive trips within 138 Caribbean scales and ecosystems. Our analysis may provide 7. F. Danielsen et al., Science 310, 643 (2005). protected areas strongly increased after they were a wider context for the interpretation of local 8. W. N. Adger, T. P. Hughes, C. Folke, 5. R. Carpenter, established (Fig. 4D). For several variables, biodiversity experiments that produced diverging J. Rockstrom, Science 309, 1036 (2005). statistical significance depended on how studies and controversial outcomes (1, 3, 24). It suggests 9. N. K. Dulvy, Y. Sadovy, J. D. Reynolds, Fish Fish. 4, 25 were weighted (Fig. 4, solid versus open circles). that very general patterns emerge on progressive- (2003). 10. H. K. Lotze et al., Science 312, 1806 (2006). This is probably the result of large variation in ly larger scales. High-diversity systems consist- 11. J. M. Pandolfi et al., Science 301, 955 (2003). sample sizes among studies (15). Despite the ently provided more services with less variability, 12. J. B. C. Jackson et al., Science 293, 629 (2001). inherent variability, these results suggest that at which has economic and policy implications. 13. B. Worm, M. Sandow, A. Oschlies, H. K. Lotze, this point it is still possible to recover lost First, there is no dichotomy between biodiversity R. A. Myers, Science 309, 1365 (2005) 7, 2012 biodiversity, at least on local to regional scales; conservation and long-term economic develop- 14. D. Raffaelli, Science 306, 1141 (2004) 15. Details on methods and data sources are available as and that such recovery is generally accompanied ment; they must be viewed as interdependent supporting material on Science Online. by increased productivity and decreased variabil societal goals. Second, there was no evidence 16. A. R. Hughes, J. J. Stachowicz, Proc. Nati. Acad. Sci. ity, which translates into extractive (fish catches for redundancy at high levels of diversity; the U.5.A. 101, 8998 (2004). around reserves) and nonextractive (tourism improvement of services was continuous on a 17. T. B. H. Reusch, A. Ehlers, A. Hammerli, B. Worm, Proc. Nath Acad. Sci. U.S.A. 102, 2826 (2005) within reserves) revenue. log-linear scale (Fig. 3). Third, the buffering 18. R. Dame et al., Aquat. Ecol. 36, 51 (2002) Conclusions. Positive relationships between impact of species diversity on the resistance and 19. J. J. Stachowicz, R. B. Whitlatch, R. W. Osman, Science diversity and ecosystem functions and services recovery of ecosystem services generates insur- 286, 1577 (1999). were found using experimental (Fig. 1) and ance value that must be incorporated into future 20. R. Watson, A. Kitchingman, A. Gelchu, D. Pauly, Fish Fish. 5, 168 (2004). correlative approaches along trajectories of economic valuations and management deci- 21. K. Sherman, A. Duda, Mar. Ecol Prog. Ser. 190, 271 diversity loss (Figs. 2 and 3) and recovery (Fig. sions. By restoring marine biodiversity through (1999). 4). Our data highlight the societal consequences sustainable fisheries management, pollution 22. R. Froese, D. Pauly, Eds., FishBase (www.fishbase.org. of an ongoing erosion of diversity that appears to control, maintenance of essential habitats, and version 12/2004). 23. R. Froese, K. Kesner-Reyes, Impact of Fishing on the be accelerating on a global scale (Fig. 3A). This the creation of marine reserves, we can invest in Abundance of Marine Species [ICES Council Meeting Report trend is of serious concern because it projects the the productivity and reliability of the goods and CM 12/L:12, International Council for the Exploration of global collapse of all taxa currently fished by the services that the ocean provides to humanity. Our the Sea (ICES), Copenhagen, Denmark, 2002] mid-21st century (based on the extrapolation of analyses suggest that business as usual would 24. D. Tilman, Ecology 80, 1455 (1999). 25. D. Tilman, P. B. Reich, J. M. H. Knops, Nature 441, 629 regression in Fig. 3A to 100% in the year 2048). foreshadow serious threats to global food securi- (2006). 26. H. Wacker, Res. Energy Econ. 21, 89 (1999). Downloaded from 27. D. Finnoff, J. Tschirhart, J. Environ. Econ. Manage. 45, 589 (2003) 28. C. M. Roberts, J. P. Hawkins, Fully-Protected Marine 1.5 Reserves: A Guide (World Wildlife Fund, Washington, DC, 2000), pp. 241-246. 29. S. R. Palumbi, in Marine Community Ecology, M. D. Bertness, S. D. Gaines, M. E. Hay, Eds. (Sinauer. Sunderland, MA, 2001), pp. 510-530. 30. This work was conducted as part of the Linking Marine 2 0.5 Biodiversity and Ecosystem Services Working Group, Ln (response ratio) supported by the National Center for Ecological Analysis and Synthesis funded by NSF, the University of California, and the Santa Barbara campus. The project was HO- stimulated by N. Loder after discussion at the conference .0.5 Marine Biodiversity: The Known, Unknown, and Unknowable, funded by the Sloan Foundation. The (43) (31) (9) (6) (5) (5) (22) (138) authors thank D. Pauly and the Sea Around Us Project (http://seaaroundus.org), supported by the the Pew Species Fished CPUE Catch Resistance Recovery Variability Dive Charitable Trusts, for access to global catch data; richness taxa trips W. Blanchard and M. Sandow for technical support; E. Green for dive trip data; and N. Baron, P. Kareiva, R. A. Myers, A Diversity B Productivity C Stability D Tourism U. Sommer, and D. Tittensor for helpful comments. Fig. 4. Recovery of diversity and ecosystem services in marine protected areas and fisheries closures. Supporting Online Material Shown are the response ratios (inside versus outside the reserve or before and after protection +95% www.sciencemag.org/cgi/content/full/314/5800/787/DC1 CI) of (A) species diversity and (B to D) ecosystem services that correspond to fisheries productivity, Methods and Data Sources ecosystem stability, and tourism revenue, respectively. Positive values identify increases in the reserve Tables S1 to $5 relative to the control; error bars not intersecting zero indicate statistical significance (P
Step by Step Solution
There are 3 Steps involved in it

Get step-by-step solutions from verified subject matter experts