

Question: I need help with this problem. Please show work! The data is posted as well. There are 5 questions Thank you Quarterly Revenue for PepsiCo,
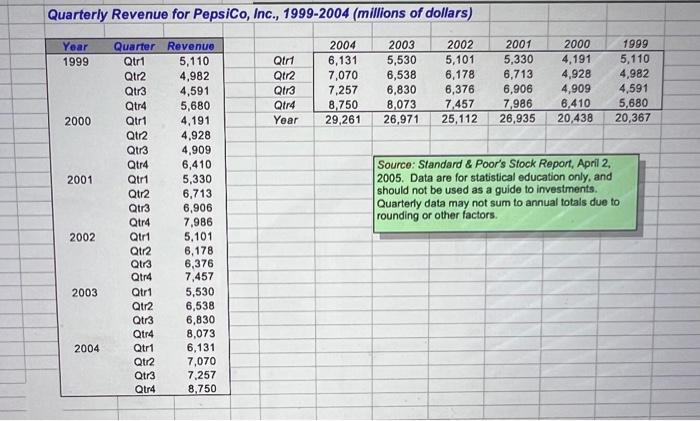

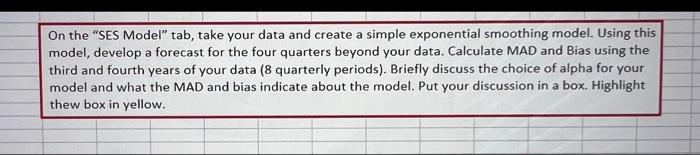
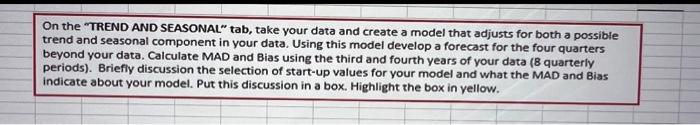
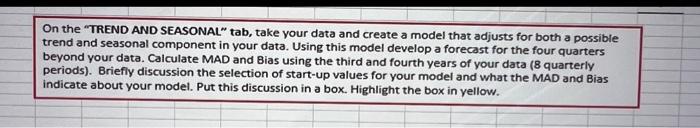
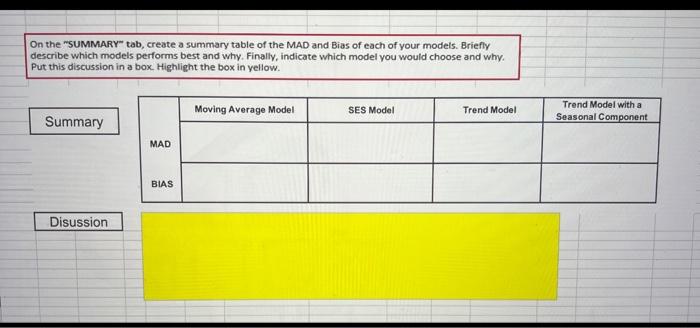
Quarterly Revenue for PepsiCo, Inc., 1999-2004 (millions of dollars) On the "MOVING AVERAGE" tab, take your data and create a moving average forecast. Using this model, develop a forecast for the four quarters beyond your data. Calculate MAD and Bias using the third and fourth years of your data ( 8 quarterly periods). Briefly discussion the selection of the number of periods selected for your model and what the MAD and Bias indicate about your model. Put this discussion in a box. Highlight the box in yellow. On the "SES Model" tab, take your data and create a simple exponential smoothing model. Using this model, develop a forecast for the four quarters beyond your data. Calculate MAD and Bias using the third and fourth years of your data (8 quarterly periods). Briefly discuss the choice of alpha for your model and what the MAD and bias indicate about the model. Put your discussion in a box. Highlight thew box in yellow. On the "TREND AND SEASONAL" tab, take your data and create a model that adjusts for both a possible trend and seasonal component in your data. Using this model develop a forecast for the four quarters beyond your data. Calculate MAD and Bias using the third and fourth years of your data (8 quarterly periods). Briefly discussion the selection of start-up values for your model and what the MAD and Bias indicate about your model. Put this discussion in a box. Highlight the box in yellow. On the "TREND AND SEASONAL" tab, take your data and create a model that adjusts for both a possible trend and seasonal component in your data. Using this model develop a forecast for the four quarters beyond your data. Calculate MAD and Bias using the third and fourth years of your data ( 8 quarterly periods). Briefly discussion the selection of start-up values for your model and what the MAD and Bias indicate about your model. Put this discussion in a box. Highlight the box in yellow. On the "SUMMARY" tab, create a summary table of the MAD and Bias of each of your models. Briefly describe which models performs best and why. Finally, indicate which model you would choose and why. Put this discussion in a box. Highlight the box in yellow
Step by Step Solution
There are 3 Steps involved in it

Get step-by-step solutions from verified subject matter experts