

Question: I need help with this problem. We need to analyze the data and draw conclusions using the table below. 3. (20 points) A plant biologist
I need help with this problem. We need to analyze the data and draw conclusions using the table below.
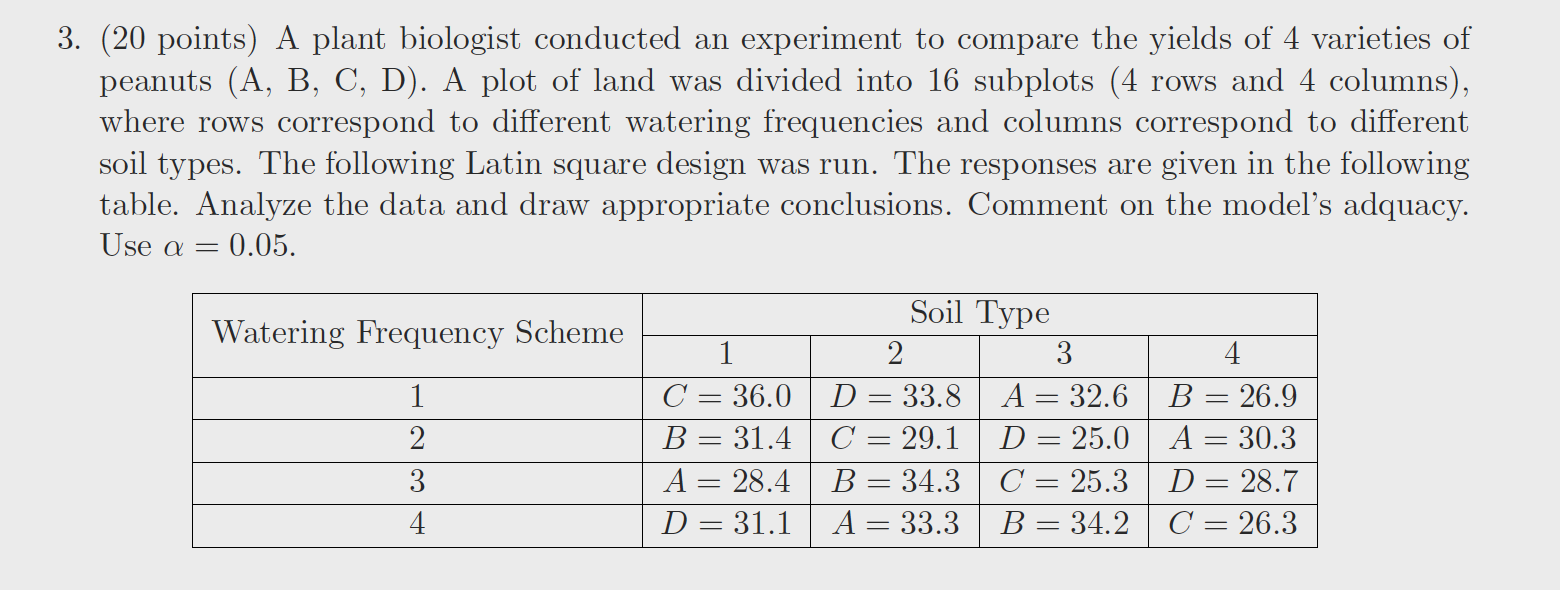
3. (20 points) A plant biologist conducted an experiment to compare the yields of 4 varieties of peanuts (A, B, C, D). A plot of land was divided into 16 subplots (4 rows and 4 columns), where rows correspond to different watering frequencies and columns correspond to different soil types. The following Latin square design was run. The responses are given in the following table. Analyze the data and draw appropriate conclusions. Comment on the model's adquacy. Use a: = 0.05. . Soil Type Waterlng Frequency Scheme 1 2 3 4 1 C = 36.0 D = 33.8 A = 32.6 B = 26.9 2 B = 31.4 C = 29.1 D = 25.0 A = 30.3 3 A = 28.4 B = 34.3 C = 25.3 D = 28.7 4 D = 31.1 A = 33.3 B = 34.2 C = 26.3
Step by Step Solution
There are 3 Steps involved in it

Get step-by-step solutions from verified subject matter experts