

Question: Please help me with this question, please show me the excel formulas as well, thank you The manager of a landline service department wished to
Please help me with this question, please show me the excel formulas as well, thank you
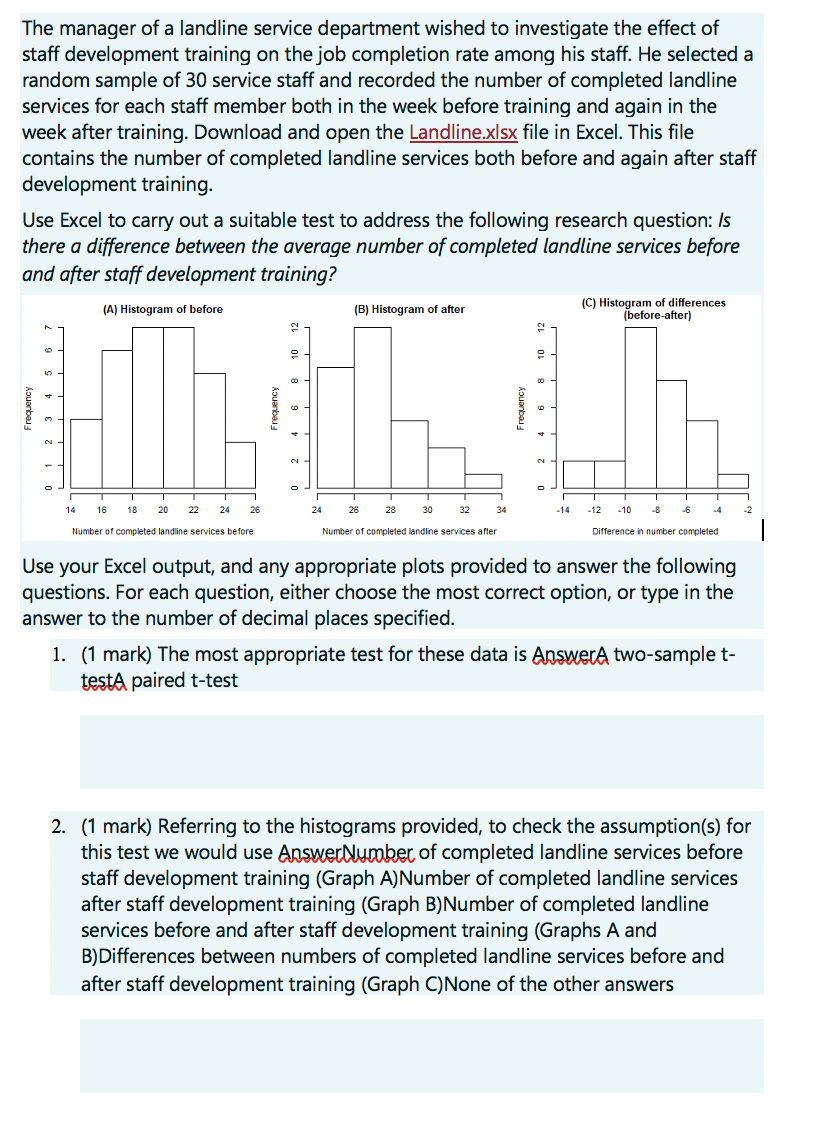
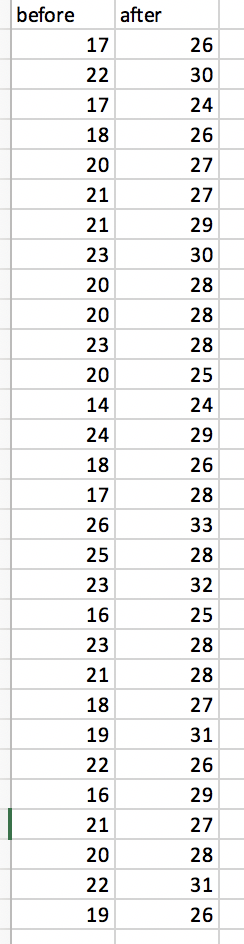
The manager of a landline service department wished to investigate the effect of staff development training on the job completion rate among his staff. He selected a random sample of 30 service staff and recorded the number of completed landline services for each staff member both in the week before training and again in the week after training. Download and open the Landline.xIsx file in Excel. This file contains the number of completed landline services both before and again after staff development training. Use Excel to carry out a suitable test to address the following research question: Is there a difference between the average number of completed landline services before and after staff development training? (A) Histogram of before (B) Histogram of after (C) Histogram of differences before-after) 12 12 10 10 5 6 Frequency Frequency Frequency 3 2 28 30 -10 Number of completed landline services before Number of completed landline services after Difference in number completed Use your Excel output, and any appropriate plots provided to answer the following questions. For each question, either choose the most correct option, or type in the answer to the number of decimal places specified. 1. (1 mark) The most appropriate test for these data is AnswerA two-sample t- testA paired t-test 2. (1 mark) Referring to the histograms provided, to check the assumption(s) for this test we would use AnswerNumber of completed landline services before staff development training (Graph A) Number of completed landline services after staff development training (Graph B)Number of completed landline services before and after staff development training (Graphs A and B) Differences between numbers of completed landline services before and after staff development training (Graph C)None of the other answersFor the remaining questions you may assume that any relevant assumptions have been met. 3. (2 marks) The absolute value of the test statistic is equal to (type your answer with 3 W 4. (1 mark) The degrees of freedom is equal to {type your answer as an M 5. (1 mark) The p-value is larger than 0.05 mm 6. (2 marks) The test indicates that the number of completed landline services: W higher, on average, after staff development Moms lower, on average, after staff development mm have been the same, on average, before and after staff development training. before after 17 26 22 30 17 24 18 26 20 27 21 27 21 29 23 30 20 28 20 28 23 28 20 25 14 24 24 29 18 26 17 28 26 33 25 28 23 32 16 25 23 28 21 28 18 27 19 31 22 26 16 29 21 27 20 28 22 31 19 26
Step by Step Solution
There are 3 Steps involved in it

Get step-by-step solutions from verified subject matter experts