

Question: I need help with this question The data set represents the responses, in degrees Fahrenheit, collected to answer the question How hot is the sidewalk
I need help with this question
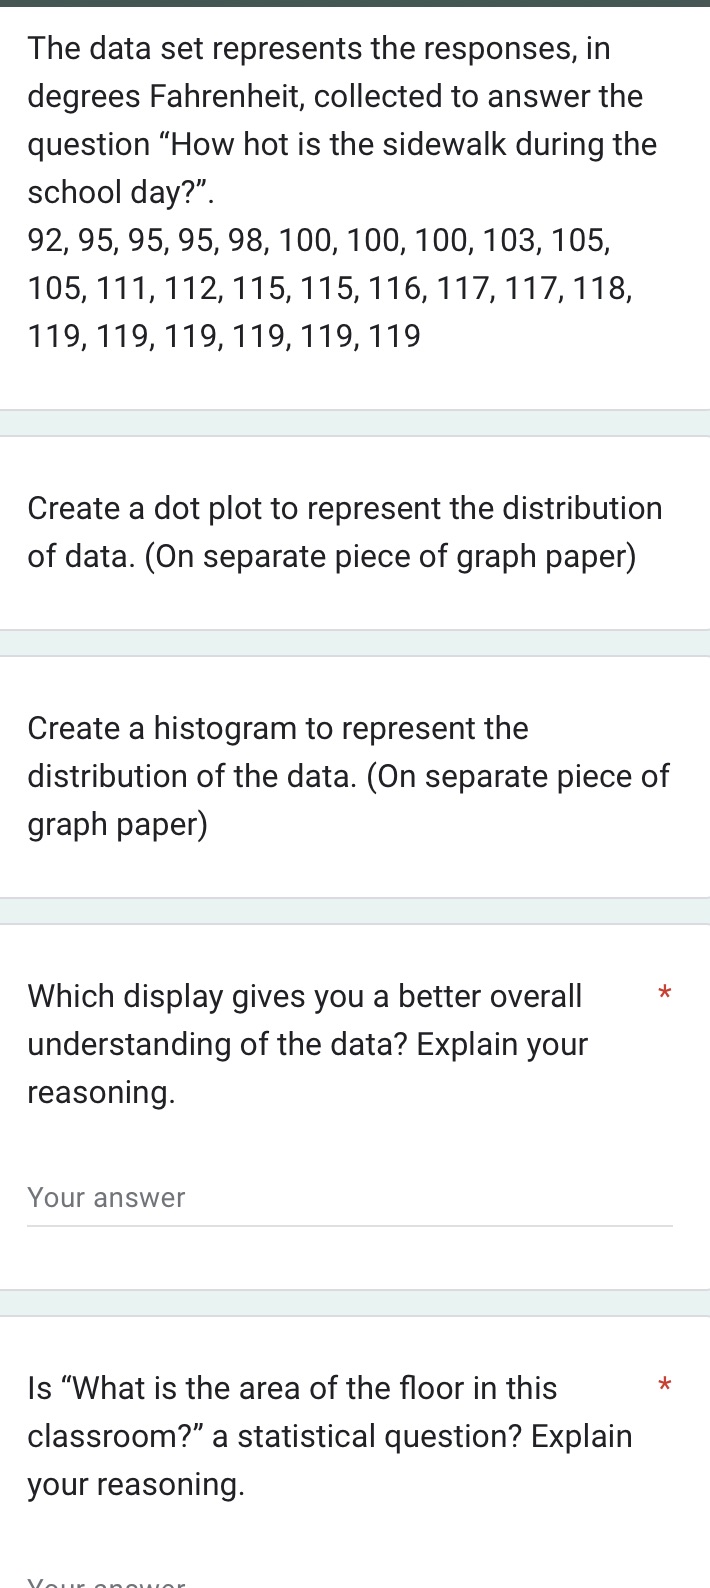
The data set represents the responses, in degrees Fahrenheit, collected to answer the question "How hot is the sidewalk during the school day?". 92, 95, 95, 95, 98, 100, 100, 100, 103, 105, 105,111,112,115,115,116,117,117,118, 119,119,119,119, 119,119 Create a dot plot to represent the distribution of data. (On separate piece of graph paper) Create a histogram to represent the distribution of the data. (On separate piece of graph paper) Which display gives you a better overall * understanding of the data? Explain your reasoning. Your answer Is "What is the area of the oor in this * classroom?" a statistical question? Explain your reasoning. \\in nnnnnnnnnnn
Step by Step Solution
There are 3 Steps involved in it

Get step-by-step solutions from verified subject matter experts