

Question: i need help with this report please. will rate! Here are the Graphs Results/Discussion 31_ 1) Discuss the coefficient of determination for each Excel graph.
i need help with this report please. will rate!
Here are the Graphs
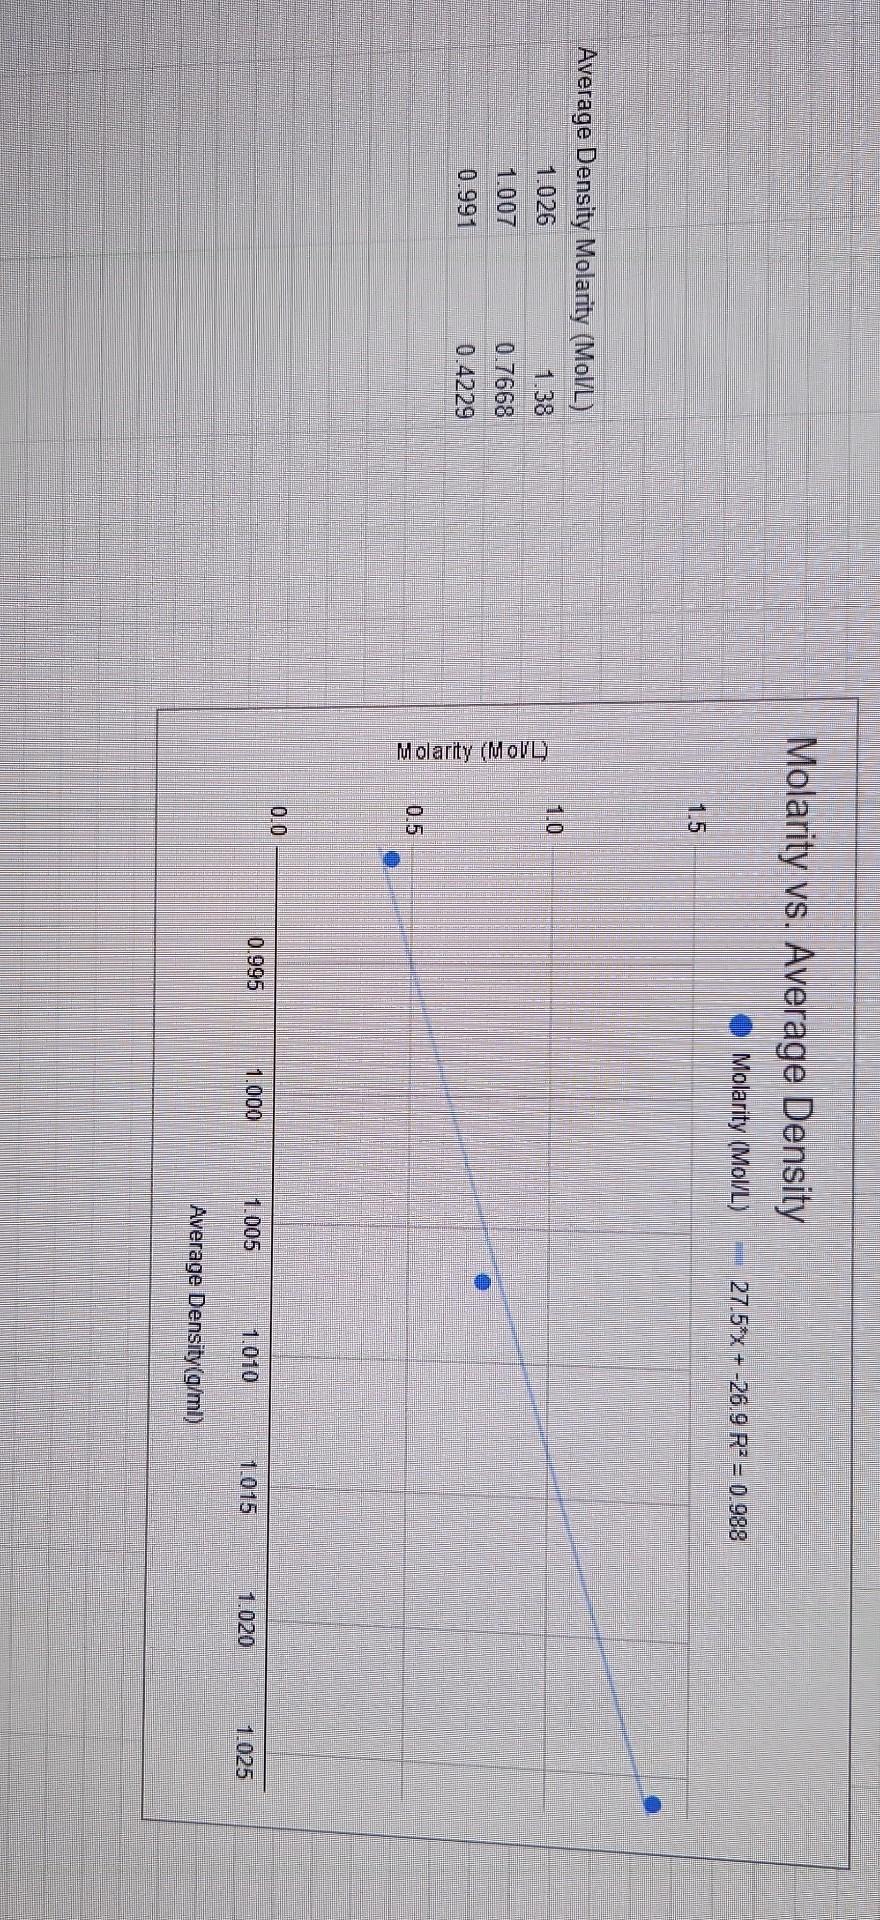
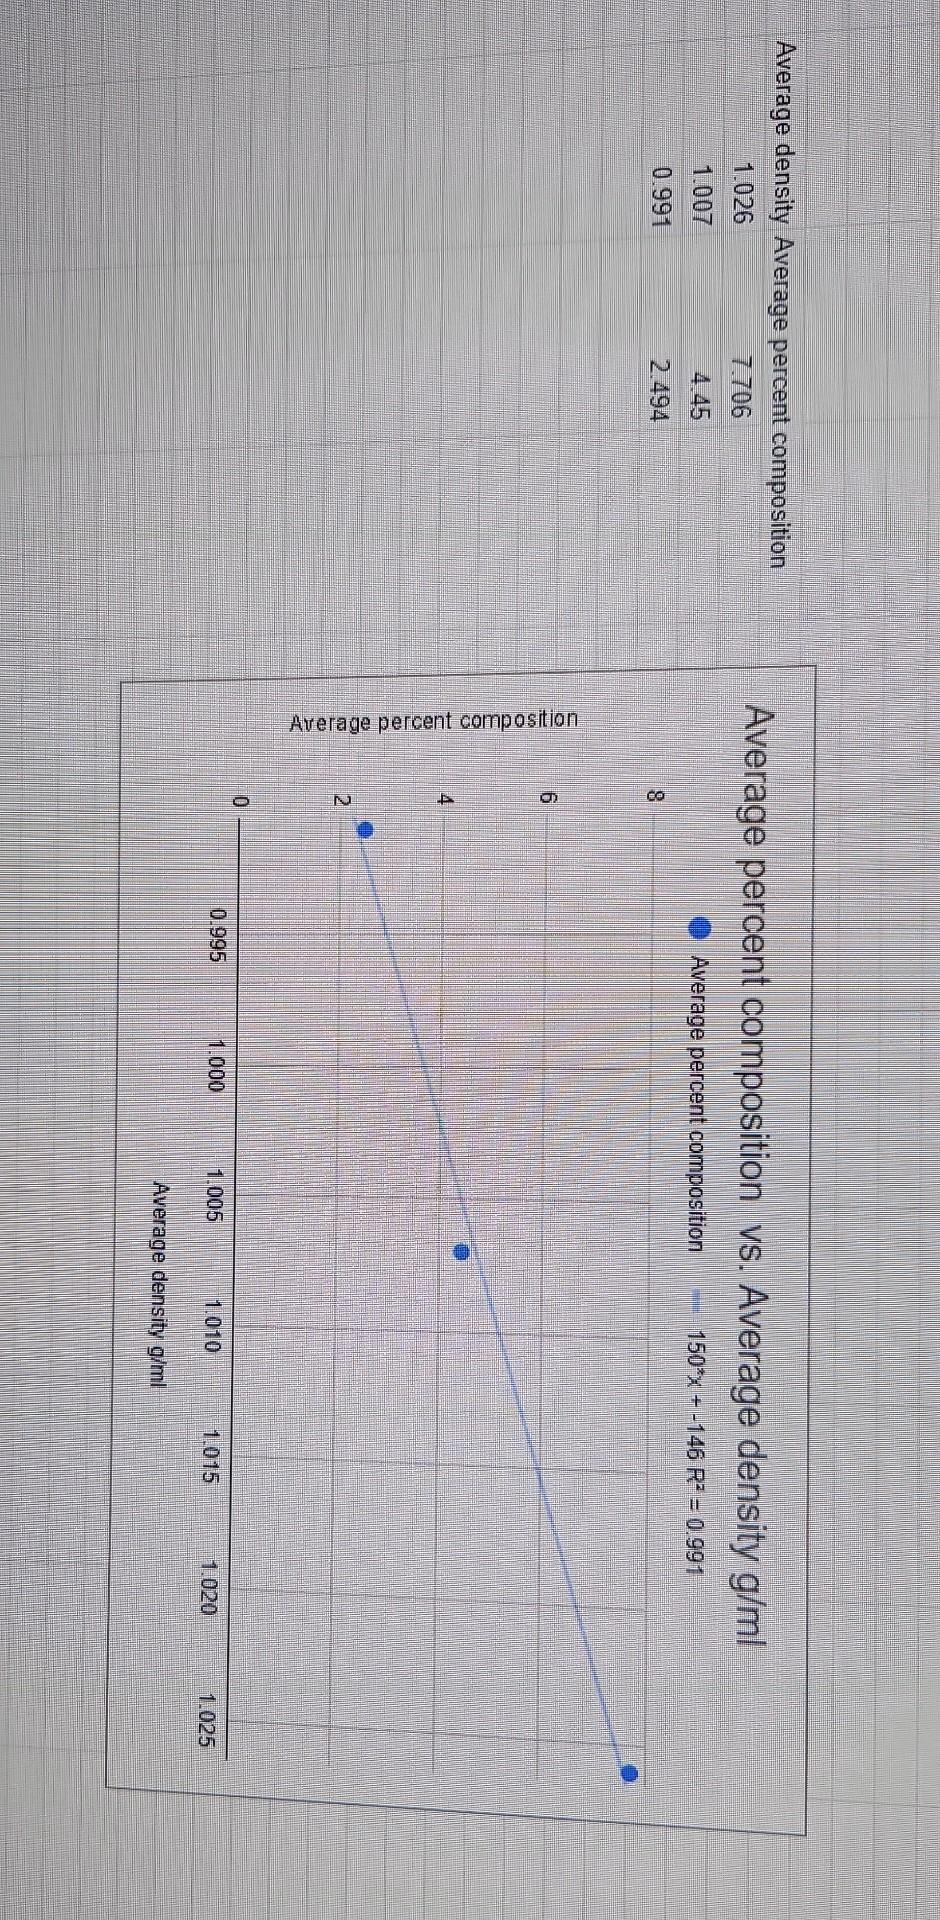
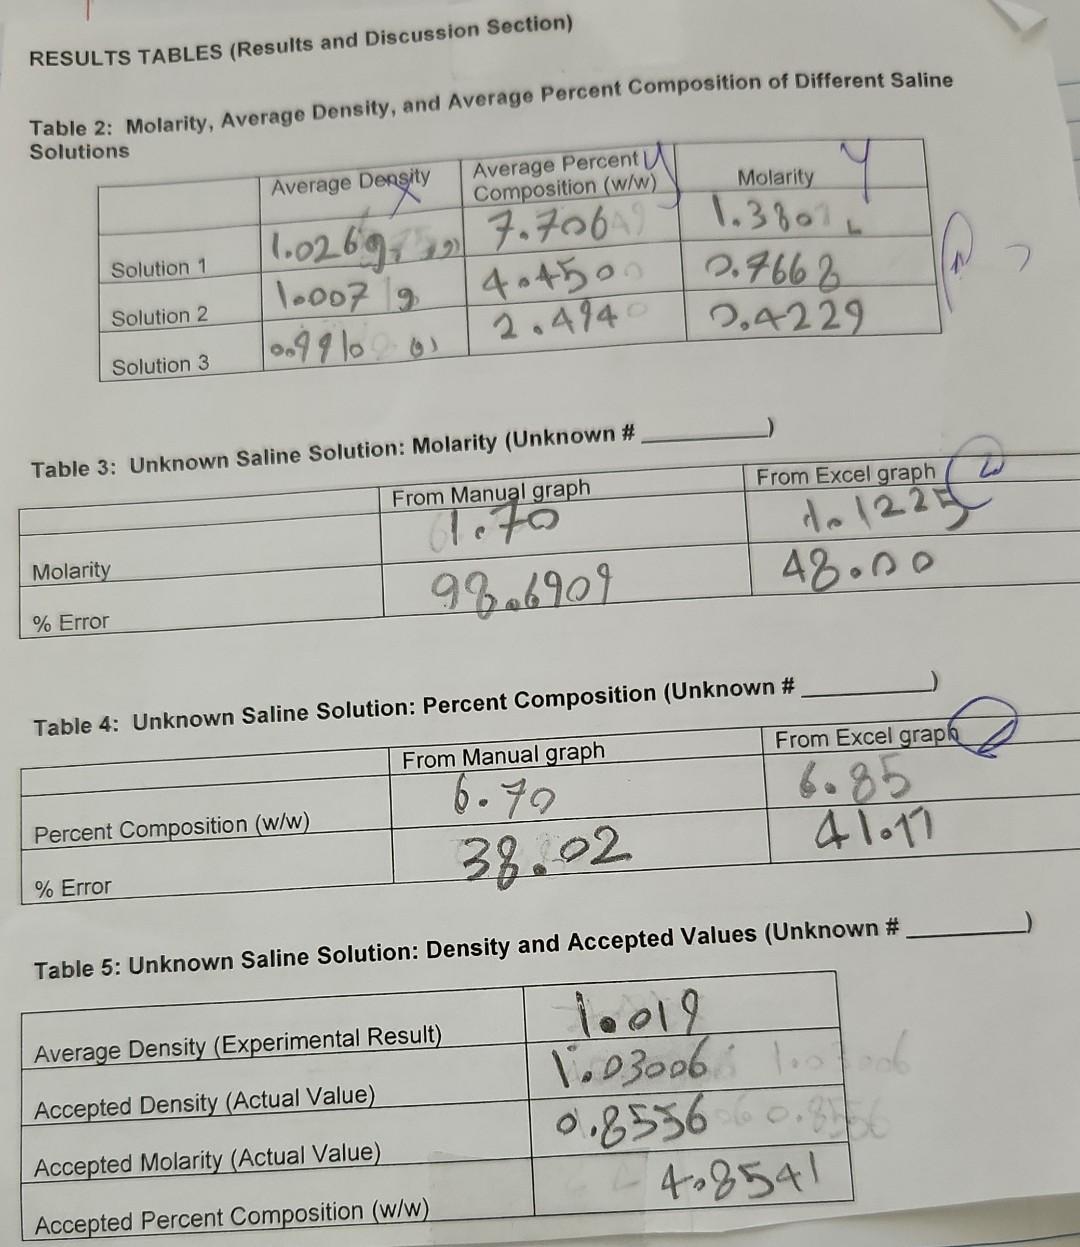
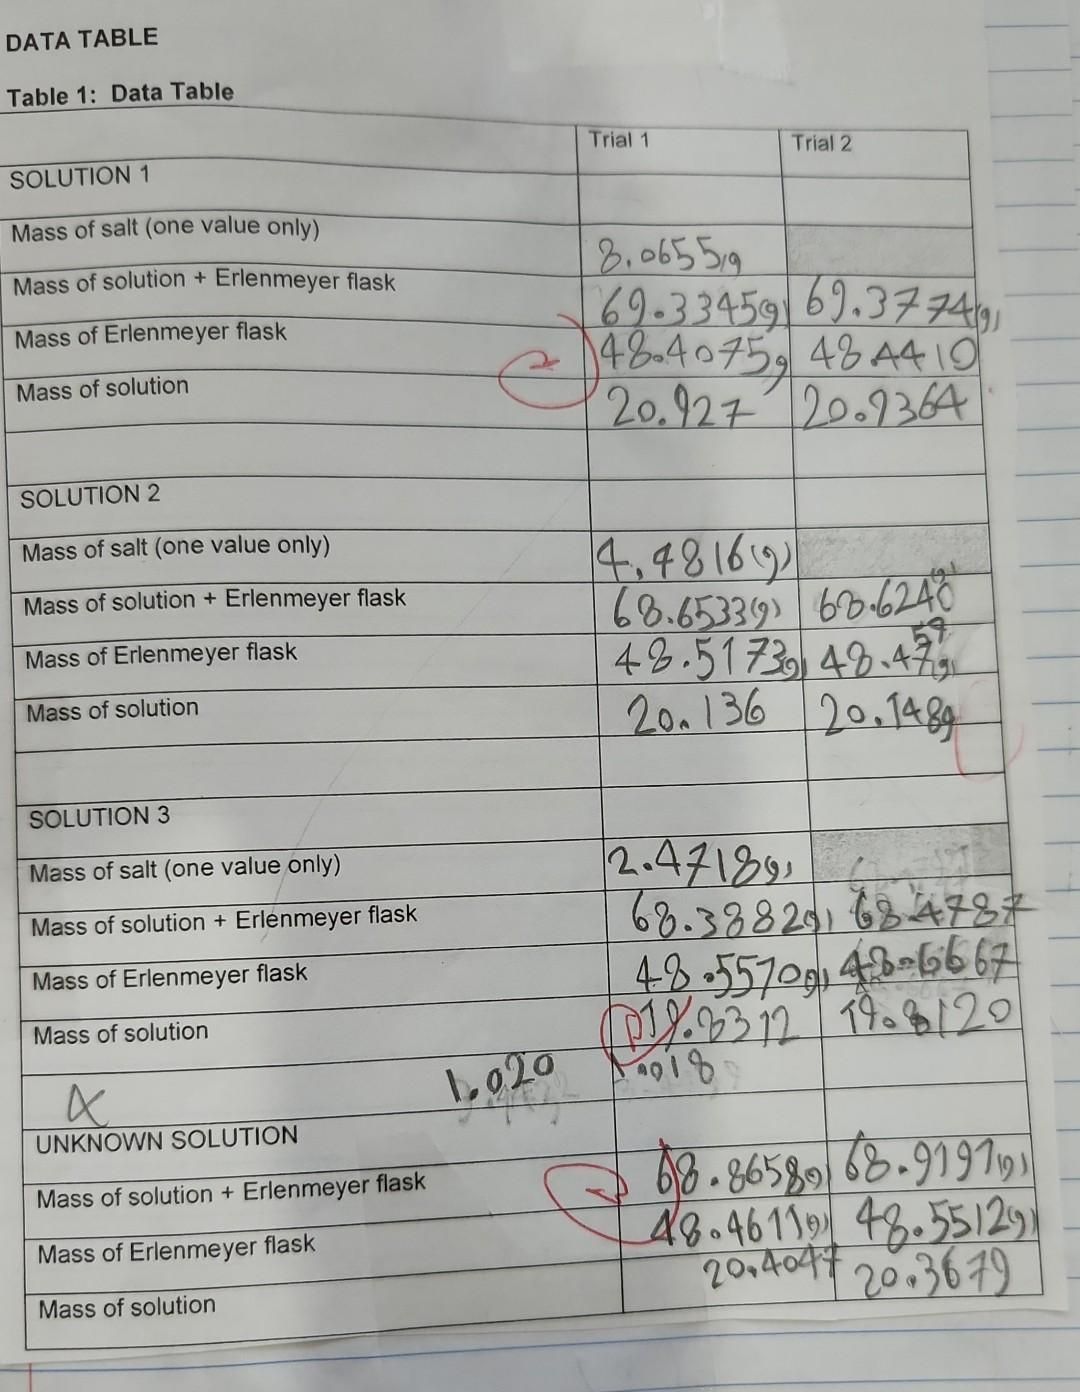
Results/Discussion 31_ 1) Discuss the coefficient of determination for each Excel graph. Is there good correlation? 2) Sources of error. Conclusion 21 1) Was the purpose of the experiment met? Compare the concentration estimates (using the numerical values you obtained from the 4 graphs) with the accepted values. 2) Any important recommendations to improve error? This should address what you wrote in the results/discussion section Molarity vs. Average Density Molarity (Mol/L) 27.5*x + -26.9 RP = 0.988 1.5 1.0 Average Density Molarity (Mol/L) 1.026 1.38 1.007 0.7668 0.991 0.4229 Molarity (MoVD) 0.5 0.0 0.995 1.000 1.005 1.010 10.15 1.020 1.025 Average Density (g/ml) Average density Average percent composition 1.026 7.706 Average percent composition vs. Average density g/ml 1.007 4.45 Average percent composition 150x + -146 R = 0.991 0.991 2.494 8. 6 Average percent composition N 2 0.995 1.000 1.005 1.010 1015 1.020 1.025 Average density g/ml RESULTS TABLES (Results and Discussion Section) Table 2: Molarity, Average Density, and Average Percent Composition of Different Saline Solutions Average Density Average Percent Composition (w/w) Molarity Solution 1 11.0269.15 7.706 404500 2.4940 1.3801 2.7662 2,4229 Solution 2 1.007 g 10.49 10 g Solution 3 Table 3: Unknown Saline Solution: Molarity (Unknown # From Excel graph From Manual graph a. 70 92.6909 to 1225 48.no Molarity % Error Table 4: Unknown Saline Solution: Percent Composition (Unknown # From Excel grapk From Manual graph 6.70 6.85 a lot Percent Composition (w/w) 38.02 % Error Table 5: Unknown Saline Solution: Density and Accepted Values (Unknown # Average Density (Experimental Result) Accepted Density (Actual Value) 10019 1.03006 10 . 0.8556 0.3 402541 Accepted Molarity (Actual Value) Accepted Percent Composition (w/w) DATA TABLE Table 1: Data Table Trial 1 Trial 2 SOLUTION 1 Mass of salt (one value only) Mass of solution + Erlenmeyer flask Mass of Erlenmeyer flask 8,0655g 69.33459) 69,37749 e 148.40759 48 4410 20.127 20.1364 Mass of solution SOLUTION 2 Mass of salt (one value only) 4,481619 68.653319) 68.6240 Mass of solution + Erlenmeyer flask 59 Mass of Erlenmeyer flask 48.5173 48.479 200 136 20.1489 Mass of solution SOLUTION 3 Mass of salt (one value only) Mass of solution + Erlenmeyer flask Mass of Erlenmeyer flask Mass of solution 12.471891 68.38829, 784787 48.55709146-6667 0193312 19.8120 1020 18 G 68.86589) 68.91971) 48.46119 48.55129) x UNKNOWN SOLUTION Mass of solution + Erlenmeyer flask Mass of Erlenmeyer flask 2014047 20 3679 Mass of solution Results/Discussion 31_ 1) Discuss the coefficient of determination for each Excel graph. Is there good correlation? 2) Sources of error. Conclusion 21 1) Was the purpose of the experiment met? Compare the concentration estimates (using the numerical values you obtained from the 4 graphs) with the accepted values. 2) Any important recommendations to improve error? This should address what you wrote in the results/discussion section Molarity vs. Average Density Molarity (Mol/L) 27.5*x + -26.9 RP = 0.988 1.5 1.0 Average Density Molarity (Mol/L) 1.026 1.38 1.007 0.7668 0.991 0.4229 Molarity (MoVD) 0.5 0.0 0.995 1.000 1.005 1.010 10.15 1.020 1.025 Average Density (g/ml) Average density Average percent composition 1.026 7.706 Average percent composition vs. Average density g/ml 1.007 4.45 Average percent composition 150x + -146 R = 0.991 0.991 2.494 8. 6 Average percent composition N 2 0.995 1.000 1.005 1.010 1015 1.020 1.025 Average density g/ml RESULTS TABLES (Results and Discussion Section) Table 2: Molarity, Average Density, and Average Percent Composition of Different Saline Solutions Average Density Average Percent Composition (w/w) Molarity Solution 1 11.0269.15 7.706 404500 2.4940 1.3801 2.7662 2,4229 Solution 2 1.007 g 10.49 10 g Solution 3 Table 3: Unknown Saline Solution: Molarity (Unknown # From Excel graph From Manual graph a. 70 92.6909 to 1225 48.no Molarity % Error Table 4: Unknown Saline Solution: Percent Composition (Unknown # From Excel grapk From Manual graph 6.70 6.85 a lot Percent Composition (w/w) 38.02 % Error Table 5: Unknown Saline Solution: Density and Accepted Values (Unknown # Average Density (Experimental Result) Accepted Density (Actual Value) 10019 1.03006 10 . 0.8556 0.3 402541 Accepted Molarity (Actual Value) Accepted Percent Composition (w/w) DATA TABLE Table 1: Data Table Trial 1 Trial 2 SOLUTION 1 Mass of salt (one value only) Mass of solution + Erlenmeyer flask Mass of Erlenmeyer flask 8,0655g 69.33459) 69,37749 e 148.40759 48 4410 20.127 20.1364 Mass of solution SOLUTION 2 Mass of salt (one value only) 4,481619 68.653319) 68.6240 Mass of solution + Erlenmeyer flask 59 Mass of Erlenmeyer flask 48.5173 48.479 200 136 20.1489 Mass of solution SOLUTION 3 Mass of salt (one value only) Mass of solution + Erlenmeyer flask Mass of Erlenmeyer flask Mass of solution 12.471891 68.38829, 784787 48.55709146-6667 0193312 19.8120 1020 18 G 68.86589) 68.91971) 48.46119 48.55129) x UNKNOWN SOLUTION Mass of solution + Erlenmeyer flask Mass of Erlenmeyer flask 2014047 20 3679 Mass of solution
Step by Step Solution
There are 3 Steps involved in it

Get step-by-step solutions from verified subject matter experts